

Daily Market Newsletter
March 30, 2019Non-Directional Strategies
Semi-Directional Strategies
Directional Strategies
Bitcoin/Crypto
View Doc's New Book
April Expiration
Day(s)
:
Hour(s)
:
Minute(s)
:
Second(s)
Market Commentary
We just notched the best first quarter to a year since 1998. How does it feel to you? To Larry Kudlow, it doesn’t feel very good at all. The White House economic advisor feels that the Fed should immediately cut 50 basis points off of the Fed Funds rate, and stop thinning out their balance sheet. In other words, cut rates and fire up the printing press again. Probability for a June rate cut now stands at 23%.
Stepping back to a quarterly chart, which is something that I never do…shows something interesting. The realized volatility is definitely expanding. Markets are getting to be more unstable, like a very heavy weight being balanced at the top of a long, skinny pole. We already know that monthly energy levels are enormous and we’re sitting on the next 500 point S&P move which will start to play out soon.
Which way will it unfurl, though? Coming to a hard forecast will only give us (at best) a 50% shot at getting the direction right and will induce confirmation bias in an attempt to justify our decision. We have to go back to principles:
- Rule #1: Larger timeframes dominate the trend. This means that large trends do not die quickly and often mean-revert, as we saw in January.
- Rule #2: Reversals start from the inside-out, and propagate higher. Any reversal to the downside will have to start at the daily, then move to the weekly charts, then finally the monthly. It’s a progression.
- Rule #3: Ascending patterns break to the downside, and vice versa.
- Rule #4: Expansion leads to Contraction, and vice versa
And the bonus rule is: “Tops are a process, bottoms are an event.”
This means that we need to force ourselves to stick with the trend until we see evidence to the contrary. Yes, the very best short entries are made BEFORE the price breaks, but I’m not interested in getting a medal for shorting the top tick as so many that let their ego drive their decisions.
I just believe that we need to continue to look for “long gamma” trades in the near future, as I believe that movement will only expand from this point.
Please sign up for our free daily crypto report here.
Offensive Actions
Offensive Actions for the next trading day:
- I’m going to place a SPY 12APR Straddle as described in the “HP Non-Directional” section below.
Defensive Actions
Defensive actions for the next trading day:
- Any vertical, butterfly, or diagonal debit spreads that we set up are risk-managed from day one, and no defense is really required.
- Closing orders have been entered for all new spreads.
Strategy Summary Graphs
Each graph below represents a summary of the current performance of a strategy category. For an explanation of what the graphs mean, watch this video.
Non-Directional Strategies
Semi-Directional Strategies
Directional Strategies
%
%
%
Technical Analysis Section
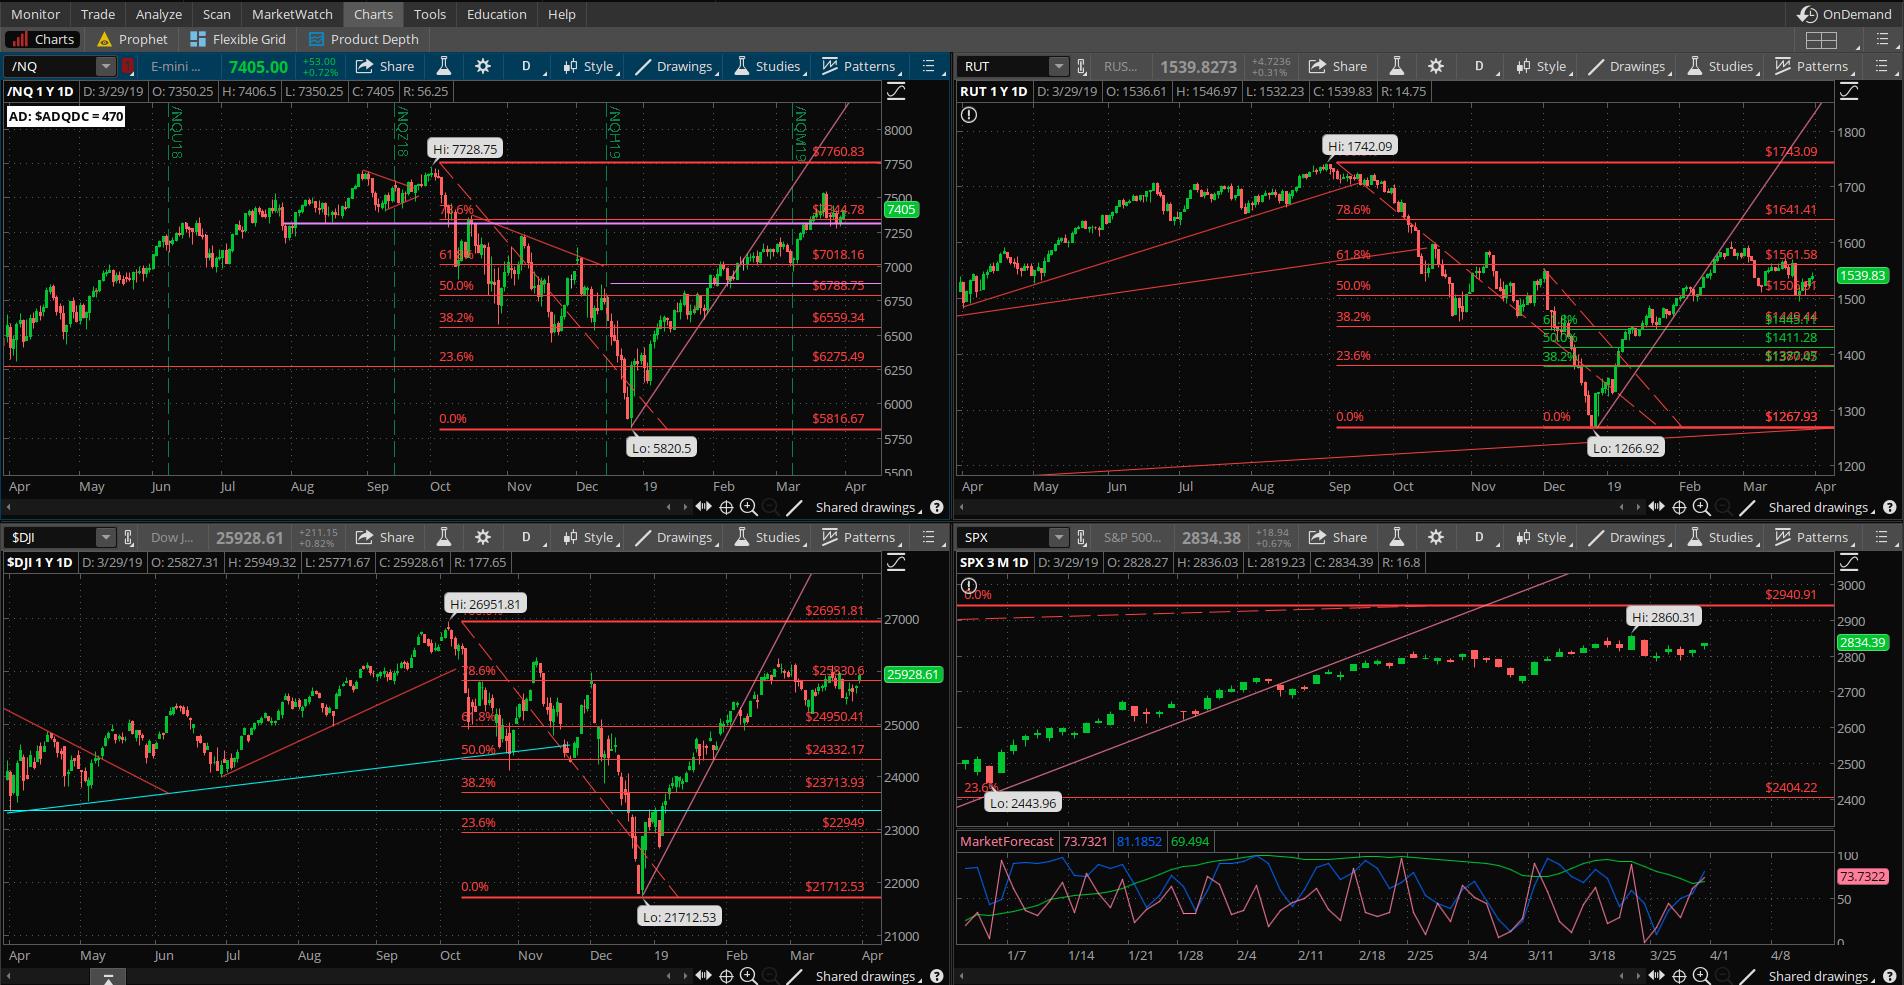
Market Internals: Volume was above-average Friday and breadth ended the day modestly stronger with +270 advancers minus decliners.
SPX Market Timer : The Intermediate line flattened below the Upper Reversal Zone, now showing a neutral bias. A weak bullish cluster was showing on the two weaker timeframes after last Friday, this is a leading signal for a bounce. This chart is once again one big rally day from a full bearish cluster.
DOW Theory: The SPX is in a long term uptrend, an intermediate uptrend, and a short-term uptrend. The RUT is in a long-term uptrend, an intermediate downtrend, and a short-term uptrend. The Dow is in an intermediate uptrend and short-term uptrend.
VIX: The VIX fell to 13.71 after peaking at 50.3 a year ago, inside the bollinger bands. The RVX fell to 17.80 and is inside the bollinger bands.
Fibonacci Retracements: The price has moved through several important Fib levels and is not caring about any confluence levels that these present. The recent retracement did not even get to the 23.6% fib retracement. We’ll see if fibs start to matter again.
Support/Resistance: For the SPX, support is at 2700 … with overhead resistance at 2941. The RUT has support at RUT 1500 with overhead resistance at 1600 and 1742. The S&P500, Russell 2000, and Nasdaq 100 have all printed a Death Cross with the 50ma crossing below the 200ma; this can be a leading signal for a true Bearish move. It can also signal “false” and create a massive swing higher. We might be seeing the latter scenario as the Dow has now printed a Golden Cross, to be followed by the SPX any day.
Fractal Energies: The major timeframe (Monthly) is charged again, with a reading of 59. The Weekly chart has an energy reading of 28, in exhaustion from the uptrend. The Daily chart is showing a level of 62 which is now massively recharged. These readings say that we should expect at least a couple of weeks of choppy price behavior but will see sharp moves during this chop due to the charged nature of the daily chart.
Other Technicals: The SPX Stochastics indicator fell to 63, mid-scale. The RUT Stochastics indicator flattened at 49, mid-scale. SPX MACD histogram rose below the signal line, showing a return of upside momentum. The SPX is inside the Bollinger Bands with Bollinger Band support at 2749 and resistance at the upper band at 2859 with price is below the upper band. The RUT is back inside the Bollinger Bands with its boundaries at 1505 to 1580 and price is above the lower band. The price is starting to release after the recent Bollinger Band squeeze.
Position Management – NonDirectional Trades
I have no positions in play.
I have avoided straddles to this point as they are somewhat expensive and are heavily affected by IV. I think we have a good shot to set up a good straddle play, however. The short-term energy on the daily chart is huge, implying heavy forward movement…yet the IV is relatively low. I’m going to set up this trade for the back week series, where the expected move is 5.678 points and the straddle price is $5.22.
This is based on a Monday morning entry at the 282.5 strike, which will probably be different once we open for business on Monday. I will just find the most “ATM” strike possible after about 15-20 minutes of letting the market settle out.
Once I enter the trade I will immediately look for a 40% return on the entire position and will not look to leg in nor leg out. This trade really favors a downside move as it’s a long-vega trade. Max risk on this trade is limited to what we pay for it but we want to avoid letting this one circle the drain.
I have the following positions in play:
- SPX 2725/2730*2860/2865 Iron Condor (3/25) entered for $2.60 credit per this weekend’s advisory. My goal is to remove this trade for a 25% return on risk. This would be a closing debit of $2.00 or less.
We are using this newfound vol to sell into as we anticipate a couple of weeks of difficult chop.
I have no current positions:
Calendar spreads are good for markets in quiet/trending character, but not sideways/volatile which might be coming next. If the market reverts back to quiet/trending, then I’ll look to continue this method.
The calendar spread tracking sheet is available for your download here. Yes, if you follow the math in the sheet, all of the numbers account for commissions in and out of the trade. Please note: If you trade these positions please keep the size small, to the point where you “do not care” about the success or failure of this position.
I have the following positions in play:
- SLV Stock – I have 1000 shares of the SLV that was assigned at the $15 level. I currently have the SLV 18APR $15.5 calls (2/11) for a $.17 credit.
- EBAY 26APR $34 puts (3/11) sold for $.73 credit. I will look to remove this trade for a $.10 debit.
- PFE 17MAY $39 puts (3/18) sold for $.39 credit.
No additional trades at this time.
Position Management – Directional Trades
Thoughts on current swing strategies:
- 8/21 EMA Crossover – Looking for the next signal.
- RSI(2) CounterTrend – None at this time.
- Daily S&P Advancers – Looking for the next signal to go long when we have single-digit advancers on the ADSPD.
- Swing – I placed a SPY 17APR 282/283 debit put spread (3/29) for $.42 debit, and will look for a 50% return from this trade. This is counter-trend but looking for a quick move lower. Get your GTC order in place and don’t wait for the move lower .
Crypto has had relative strength over the last few weeks and no one believes this rally.
Investors should currently be looking to find technical entries to warehouse BTC/ETH/LTC assets for eventual trades on Alt-coins. You should also be looking to devices like “trezor” or other cold-storage devices to keep your assets off of the network, or other secure wallet such as Navcoin. Relying on the security of your broker is no longer good enough; no one can log into your ETrade account and “steal” your stock assets, but the whole nature of Cryptocurrencies and their portability means that someone can grab your assets and transfer them elsewhere. I will continue to discuss the tradingview platform in daily videos as I think that it is currently the best way to chart the “big three.”
From Friday’s close at SPY 282.48, there is a +/-3.79 EM into this coming Friday; this is significantly smaller than last week’s 5.268 EM and is more in-line with the norms. The EM targets for this Friday’s close are 286.27 to the upside, and 278.69 to the downside.
Last week did not show much of an attack on either EM limit. With this week’s amount of short-term energy and the move into a new quarter, we might start to see movement to press one side of the EM again
I will start playing directional bear spreads once we see upside exhaustion on more than one timeframe.
The scan that I discussed in the 8/4/2018 video is available to download for thinkorswim here: http://tos.mx/OvdVnz I will also be adding a second Larry Connors scan to this section as well; here is the Connors Crash scan: http://tos.mx/BhHuKL
I have no positions in play at this time.
- UPS 29MAR 112/113 Debit Call Spread (3/4) entered for $.50 debit and closed for a $.10 credit (3/29).
.
The “Hindenburg Strategy” is meant to capture “value” from successive corrections that lead up to the final “death spiral” with a Bear Market. The basic principle is to buy 3-month out long puts on the SPY, and to finance those puts by the sale of credit spreads.
I have no positions at this time. I cleared out the most recent set of puts on the drop to the 200ma back in October. I will “reload” again soon, if/when the weekly chart goes into upside exhaustion. The three-month puts are coming down in price closer to what I’d prefer to pay. (3 months out/90% of current value)