
Daily Market Newsletter
March 14, 2019Non-Directional Strategies
Semi-Directional Strategies
Directional Strategies
Bitcoin/Crypto
View Doc's New Book
March Expiration
Day(s)
:
Hour(s)
:
Minute(s)
:
Second(s)
Market Commentary
New Home Sales was slightly below estimates today, which was just enough of a catalyst to let prices drift sideways today. The S&P500 sectors cancelled each other out in a dead heat, and in general it was a below-average volume day without a lot of conviction either way. In short, this was the perfect consolidation day for all of the indices that are completely out of gas at the weekly chart level.
IV percentile on the SPX is 10%, which is relatively low. Certainly we’ve had our share of volatility over the last 252 trading days, but implied forward moves are somewhat low right now as we await the Fed next week. I would not be surprised to see the price just consolidate at this level for another week. In today’s video I’ll discuss potentially setting up very short-term iron condors, and it might be time to consider using time spreads again.
As long as we have a dovish Fed, we should continue to expect money to be plowed into equities. Be careful of the “lower high” in some indices, however.
Please sign up for our free daily crypto report here.
An embedded flash video is available here.
Offensive Actions
Offensive Actions for the next trading day:
- No trades for tomorrow; we’ll reset our offense this weekend .
Defensive Actions
Defensive actions for the next trading day:
- Any vertical, butterfly, or diagonal debit spreads that we set up are risk-managed from day one, and no defense is really required.
- Closing orders have been entered for all new spreads.
Strategy Summary Graphs
Each graph below represents a summary of the current performance of a strategy category. For an explanation of what the graphs mean, watch this video.
Non-Directional Strategies
Semi-Directional Strategies
Directional Strategies
%
%
%
Technical Analysis Section
Market Internals: Volume was below-average today and breadth ended the day mixed at -25 advancers minus decliners.
SPX Market Timer : The Intermediate line rose into the Upper Reversal Zone, now showing a bullish bias. This chart is very close to a strong bearish cluster again.
DOW Theory: The SPX is in a long term uptrend, an intermediate uptrend, and a short-term uptrend. The RUT is in a long-term uptrend, an intermediate uptrend, and a short-term uptrend. The Dow is in an intermediate uptrend and short-term uptrend.
VIX: The VIX fell to 13.50 after peaking at 50.3 a year ago, inside the bollinger bands. The RVX fell to 15.87 and is back inside the bollinger bands.
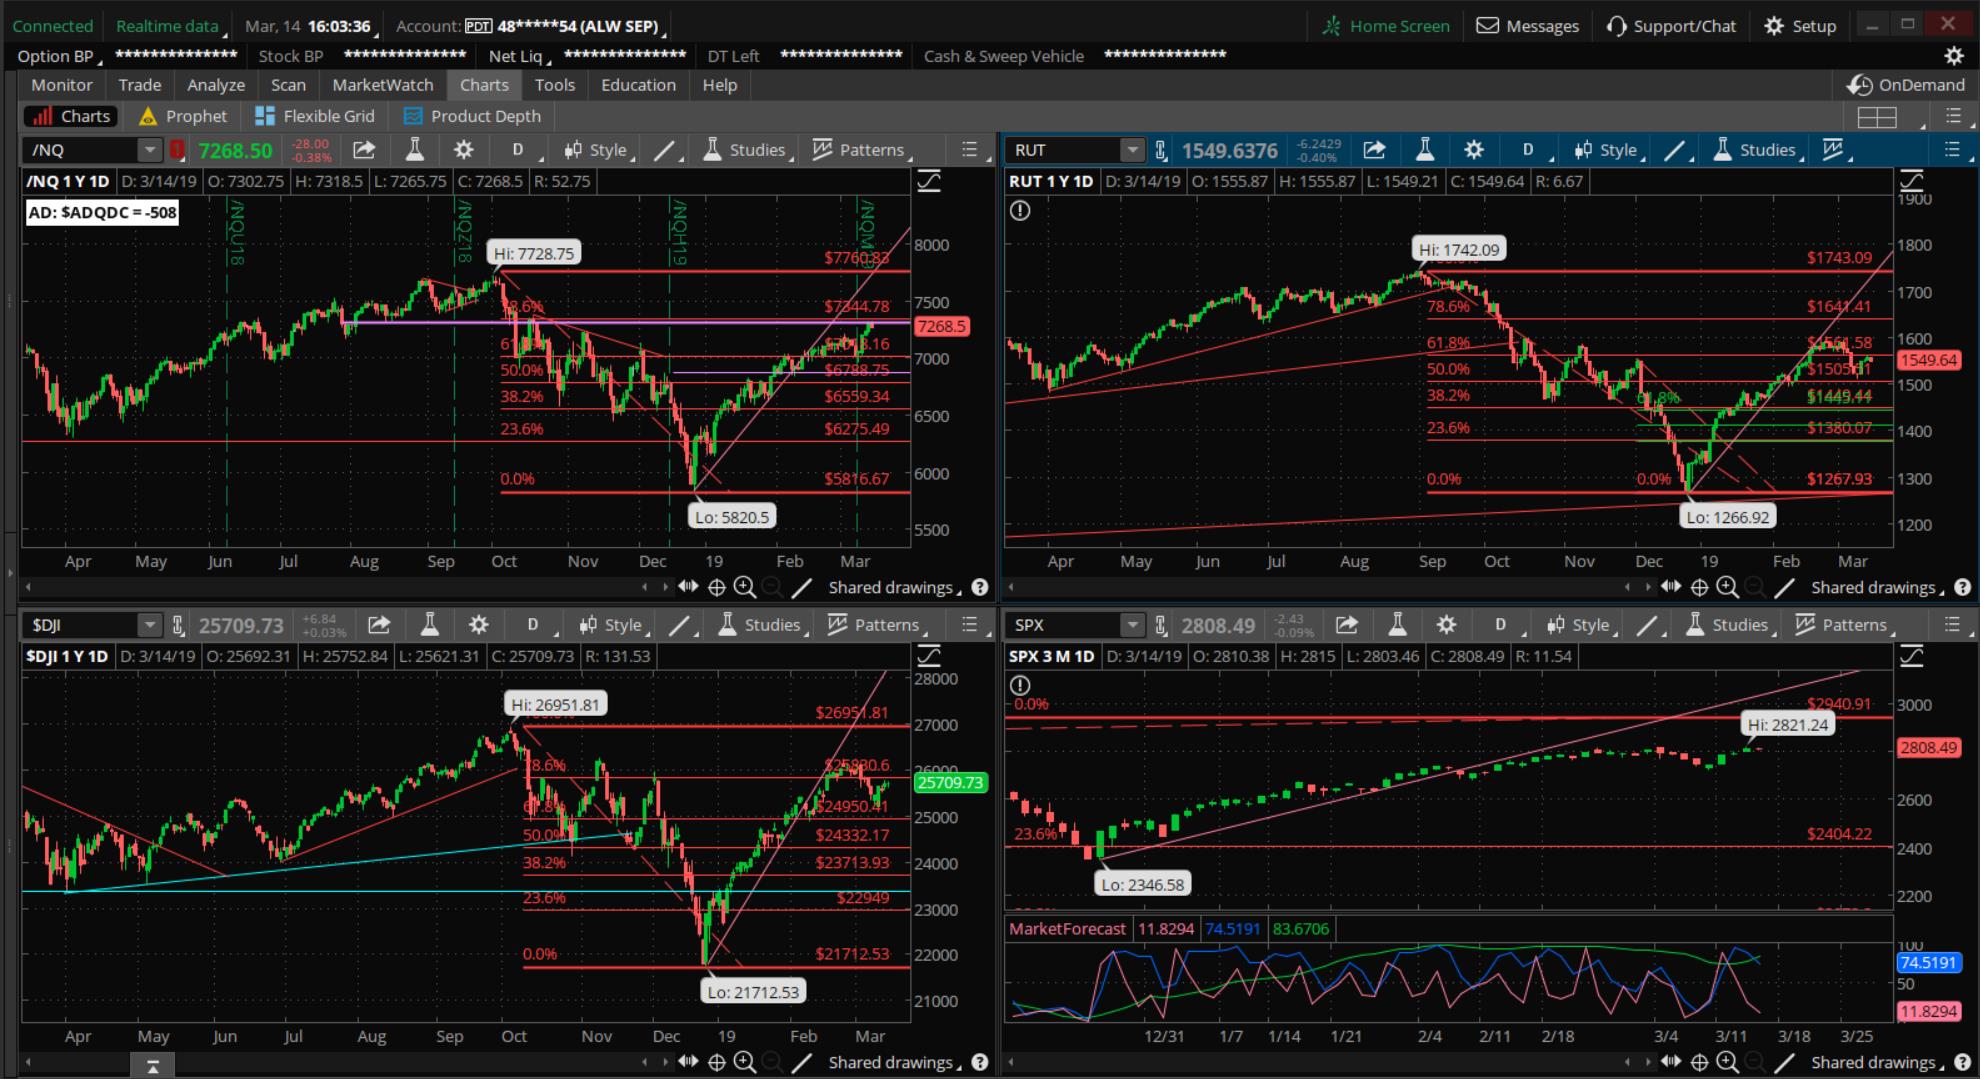
Fibonacci Retracements: The price has moved through several important Fib levels and is not caring about any confluence levels that these present.
Support/Resistance: For the SPX, support is at 2700 … with overhead resistance at 2815 and 2941. The RUT has support at RUT 1500 with overhead resistance at 1742. The S&P500, Russell 2000, Dow, and Nasdaq 100 have all printed a Death Cross with the 50ma crossing below the 200ma; this can be a leading signal for a true Bearish move. It can also signal “false” and create a massive swing higher. We might be seeing the latter scenario.
Fractal Energies: The major timeframe (Monthly) is charged again, with a reading of 58. The Weekly chart has an energy reading of 37, in exhaustion from the uptrend. The Daily chart is showing a level of 46 which is recharging very quickly due to the chop over the past week.
Other Technicals: The SPX Stochastics indicator rose to 53, mid-scale. The RUT Stochastics indicator fell to 34, below mid-scale. SPX MACD histogram rose below the signal line, showing a return of upside momentum. The SPX is inside the Bollinger Bands with Bollinger Band support at 2746 and resistance at the upper band at 2821 with price is below the upper band. The RUT is inside the Bollinger Bands with its boundaries at 1523 to 1605 and price is below the upper band. The Bollinger Bands are starting to squeeze again.
Position Management – NonDirectional Trades
I have the following positions in play:
- SPY 27MAR 271/272*287/288 Long Iron Condor (2/25) entered for $.18 debit on the call spreads and $.16 debit on the put spreads. I will look for a 200% return on each side individually and may the best side win.
No additional trades for now.
I have no positions in play.
Waiting for the next condition to sell options again; realized vol is out-pacing implied vol again. The rebound off of the bottom has been violent and traders are chasing after the move.
I have no remaining positions. Calendar spreads are good for markets in quiet/trending character, so we’ll want to wait for that type of price action to show again. I would like to see how the price handles the first pullback before I jump into this style again. It does not work well when realized vol out-races implied vol.
The calendar spread tracking sheet is available for your download here. Yes, if you follow the math in the sheet, all of the numbers account for commissions in and out of the trade. Please note: If you trade these positions please keep the size small, to the point where you “do not care” about the success or failure of this position.
I have the following positions in play:
- SLV Stock – I have 1000 shares of the SLV that was assigned at the $15 level. I currently have the SLV 18APR $15.5 calls (2/11) for a $.17 credit.
- EBAY 26APR $34 puts (3/11) sold for $.73 credit. I will look to remove this trade for a $.10 debit.
No additional setups at this time. .
Position Management – Directional Trades
Thoughts on current swing strategies:
- 8/21 EMA Crossover – Looking for the next signal.
- RSI(2) CounterTrend – None at this time.
- Daily S&P Advancers – Looking for the next signal to go long when we have single-digit advancers on the ADSPD.
- Swing – I have no positions at this time.
Crypto has gotten a little bump in the last few days; heads are poking up to see if this rally is “real.”
Investors should currently be looking to find technical entries to warehouse BTC/ETH/LTC assets for eventual trades on Alt-coins. You should also be looking to devices like “trezor” or other cold-storage devices to keep your assets off of the network, or other secure wallet such as Navcoin. Relying on the security of your broker is no longer good enough; no one can log into your ETrade account and “steal” your stock assets, but the whole nature of Cryptocurrencies and their portability means that someone can grab your assets and transfer them elsewhere. I will continue to discuss the tradingview platform in daily videos as I think that it is currently the best way to chart the “big three.”
The EM targets for this Friday’s close are 279.08 to the upside, and 269.84 to the downside.
The price has closed above the upper EM and the fade play is off. Also be careful as the SPY goes ex-div on Friday so careful with any short call options.
I will start playing directional bear spreads once we see upside exhaustion on more than one timeframe.
The scan that I discussed in the 8/4/2018 video is available to download for thinkorswim here: http://tos.mx/OvdVnz I will also be adding a second Larry Connors scan to this section as well; here is the Connors Crash scan: http://tos.mx/BhHuKL
I have the following positions in play:
- DE 15MAR 165/167.5 Debit Call spread (2/25) entered for $1.27 debit. This one will expire OTM tomorrow, just not enough time.
- UPS 29MAR 112/113 Debit Call Spread (3/4) entered for $.50 debit.
- SBUX 29MAR 71/72 Debit Call Spread (3/4) entered for $.50 debit.
- CSCO 26APR 52/53 Debit Call Spread (3/13) entered for $.50 debit.
No additional trades for now. The Weekly exhaustion on the S&P is going to give markets a headwind for a couple of weeks..
The “Hindenburg Strategy” is meant to capture “value” from successive corrections that lead up to the final “death spiral” with a Bear Market. The basic principle is to buy 3-month out long puts on the SPY, and to finance those puts by the sale of credit spreads.
I have no positions at this time. I cleared out the most recent set of puts on the drop to the 200ma back in October. I will “reload” again soon, if/when the weekly chart goes into upside exhaustion. The three-month puts are coming down in price closer to what I’d prefer to pay. (3 months out/90% of current value)