Daily Newsletter
February 22, 2020Non-Directional Strategies
Semi-Directional Strategies
Directional Strategies
Bitcoin/Crypto
View Doc's New Book
March Expiration
Day(s)
:
Hour(s)
:
Minute(s)
:
Second(s)
Market Commentary
Over the past weeks, I had mentioned that just a few stocks in the NASDAQ/S&P were pushing everything else higher. We’ve seen this occur again and again over the past ten years of easy money policy and these moves can go forever….however when the big dogs catch the flu, everyone else suffers. On Friday we saw these stocks perform:
- AMZN – down 2.65%
- AAPL – down 2.26%
- FB – down 2.05%
- MSFT – down 3.16%
- NVDA – down 4.74%
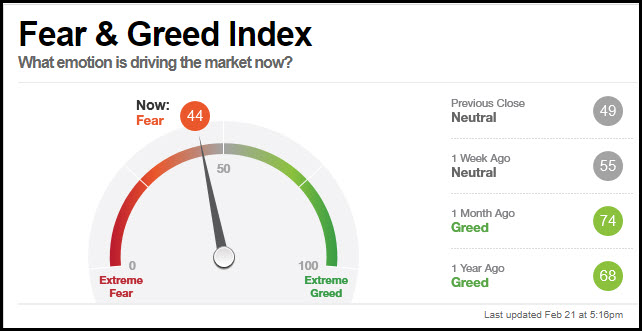
Sentiment was damaged as we can see from the fear/greed index:

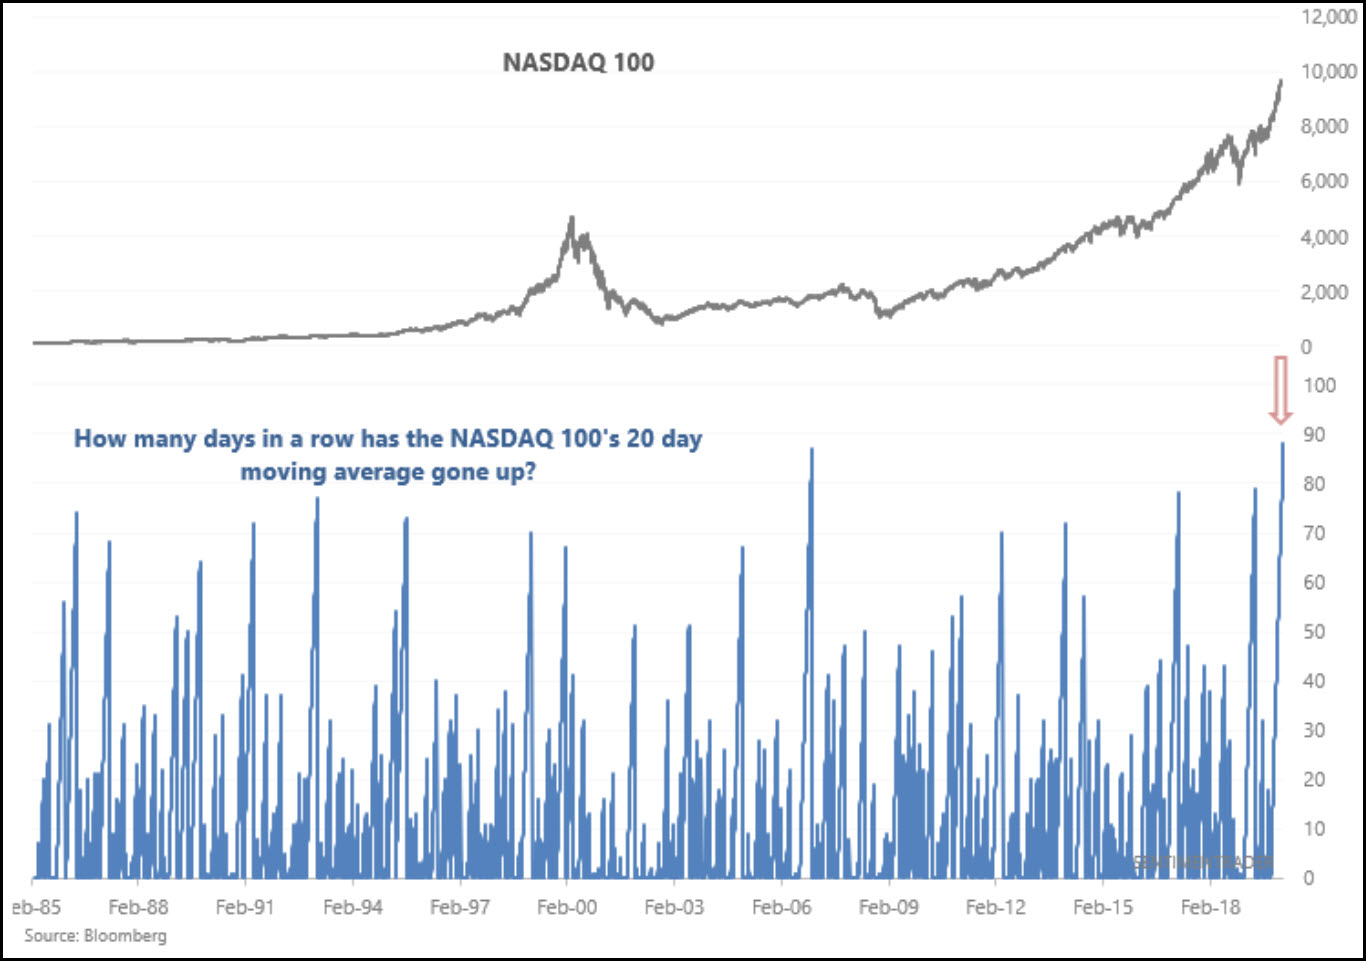
Something else of note from Sentimentrader is that the NASDAQ’s 20day SMA has gone up for 88 days in a row, the most in history.

Before we instantly put a fork in this market and proclaim it dead, note that the Ten Year Note continues to fall which should continue to push money into yield-producing instruments. Note also that there was divergence to those 20day-sma spikes in the graph above before the ultimate fall in 2000 and 2008. This might just be a simple warning shot over the bow before the real fireworks begin. And understand that markets will first transition to loud, volatile sideways markets before they ultimately fail into a Bear.
What to do in the meantime? Let’s see if we can use the dip to our advantage in the near term. Ultimately the probabilities favor higher prices after these energies recover. It’s relatively rare when ALL timeframes are in exhaustion and that was the case last week.
The market’s on its own from here, the next Fed Meeting policy release is March 18th.
Earnings season is just about over with some Retail and Energy stocks left to report for the cycle.
Subscriber Update: I will be “grandfathering” OptionsLinebacker and DocsTradingTools customers over to a new advisory service, targeting the late February timeframe. I intend to make this service more “actionable” with more trade alerts, and plan to include guest contributors who are experts in their specific strategies. If there are any elements of the OLD (existing) service that you want to make sure are carried into the new service, please let me know by dropping me at line at doc@docstradingtools.com
Short-Term Outlook: Prices are breaking from a massive consolidation pattern in play since early 2018, or almost another “horizontal bear market” like we had in 2015-2016. At this point we’re wondering how far this swing could go, yet it’s showing incredible resilience.
Please sign up for our free daily crypto report here.
Offensive Actions
Offensive Actions for the next trading day:
- No trades for Monday; I want to see if this pullback extends a little deeper so that we can put some mechanical swing strategies into place.
Defensive Actions
Defensive actions for the next trading day:
- Any vertical, butterfly, or diagonal debit spreads that we set up are risk-managed from day one, and no defense is really required.
- We need to look for continued weakness this week to put our LP Short SPX Condor in the black and take profits.
Strategy Summary Graphs
Each graph below represents a summary of the current performance of a strategy category. For an explanation of what the graphs mean, watch this video.
Non-Directional Strategies
Semi-Directional Strategies
Directional Strategies
%
%
%
Technical Analysis Section
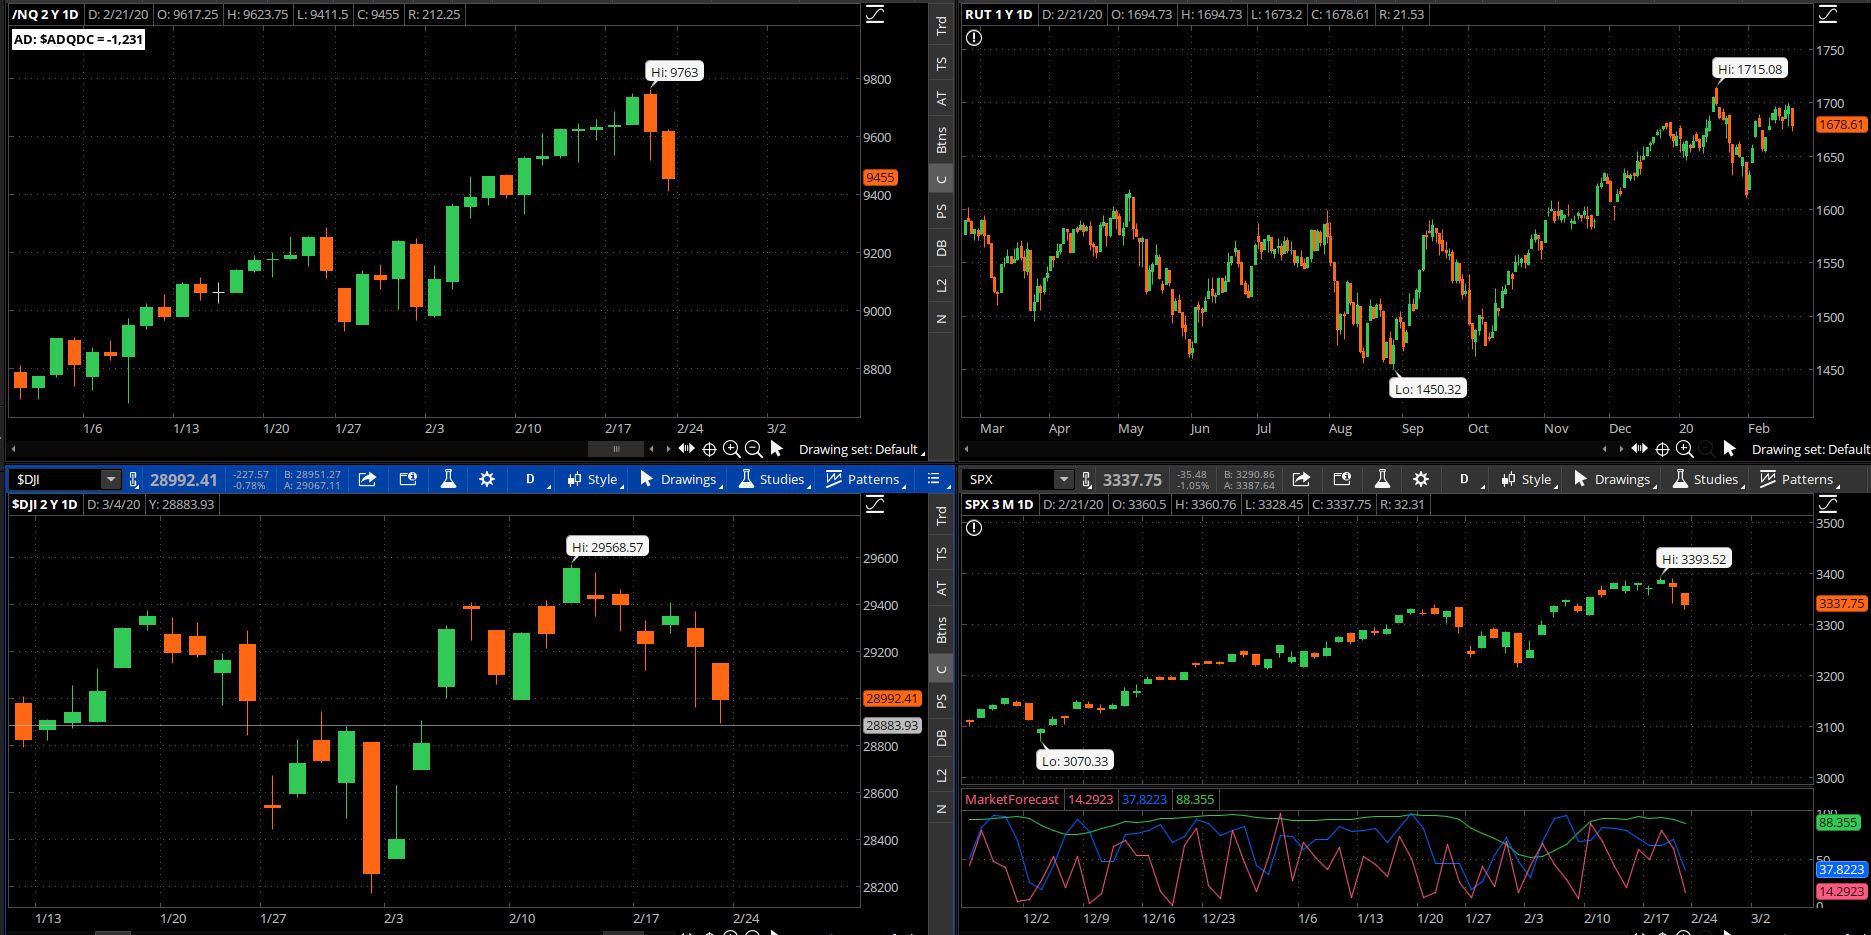
Market Internals: Volume was above-average today, with the advancers minus decliners showing a mixed value of +15 by the closing bell, and a low mark of -272 late morning.
SPX Market Timer : All three lines declined on Friday. The Intermediate line has flattened into the Upper Reversal Zone and is still “bullish.” No leading signals today.
DOW Theory: The SPX is in a long term uptrend, an intermediate uptrend, and a short-term downtrend. The RUT is in a long-term uptrend, an intermediate uptrend, and a short-term sideways trend. The Dow is in an intermediate uptrend and short-term downtrend.
VIX: The VIX rose to 17.08, inside the Bollinger bands. The RVX rose to 18.94 and is inside the Bollinger bands.
Fibonacci Retracements: Fib retracements are irrelevant as long as the prices keep making new highs.
Support/Resistance: For the SPX, support is at 3070 with overhead resistance at 3394. The DOW has support at 27325 and overhead resistance at 29569. The RUT has support at 1580 and resistance around 1715.
Fractal Energies: The major timeframe (Monthly) is into exhaustion now at a value of 33, and is starting to reflect energy bleed from the very linear trend from late 2018. The Weekly chart has an energy reading of 38, just into exhaustion and starting to bleed energy again due to the upside strength of the last three weeks. The Daily chart is showing 39, just above exhaustion again.
Other Technicals: SPX Stochastics fell to 89, overbought. RUT Stochastics flattened at 83, overbought. The SPX MACD fell below the signal line, showing a decrease in positive momentum. The SPX is below the upper bollinger band with the range 3224 to 3423. The RUT is below the upper bollinger band with the range 1624 and 1711.

Position Management – NonDirectional Trades
I have no positions in play at this time.
No additional trades at this time.
We are not in a good mode for the traditional “High Probability” short iron condors since the price movement has been incredibly directional, and the Implied Vol is reflective of this with a very low/complacent value. Not good odds to sell options right now, better odds to buy them and go “long gamma.”
I have the following positions in play:
- SPX 28FEB 3150/3155*3320/3325 LP Iron Condor was entered for $2.55 credit (2/3) and will look for a 25% return on risk.
This week I’ll want to do what I can to close this position out for a profit. This will require the price to continue distributing, which has been a very rare thing of late. Gamma will make this a very difficult process this week.
I have no open positions at this time.
This is the wrong type of price character to play Time Spreads; we’re seeing vol crush and a huge buying panic.The previous fear about Corona has disappeared overnight.
The calendar spread tracking sheet is available for your download here. Yes, if you follow the math in the sheet, all of the numbers account for commissions in and out of the trade. Please note: If you trade these positions please keep the size small, to the point where you “do not care” about the success or failure of this position.
I have the following positions in play:
- SLV Stock – I have 1000 shares of the SLV that was assigned at the $15 level. Looking for the next rally to sell calls against.
- BAC 03APR $32.5 Puts (2/18) were sold for $.33 credit.
No additional trades at this time.
We’ll look for the next pullback to potentially sell puts against our next candidate.
Position Management – Directional Trades
Thoughts on current swing strategies:
- 8/21 EMA Crossover – Awaiting the next signal.
- RSI(2) CounterTrend – I’ll look for the next setup.
- Daily S&P Advancers – Looking for the next signal to go long with single-digit advancers to close the day; stay tuned for this signal to show in the near future.
- Swing – I have no positions in play:
BTC and other top-ten coins have been breaking higher in 2020. The price action looks very good and is moving into linear formation.
Investors should currently be looking to find technical entries to warehouse BTC/ETH/LTC assets for eventual trades on Alt-coins. You should also be looking to devices like “trezor” or other cold-storage devices to keep your assets off of the network, or other secure wallet such as Navcoin. Relying on the security of your broker is no longer good enough; no one can log into your ETrade account and “steal” your stock assets, but the whole nature of Cryptocurrencies and their portability means that someone can grab your assets and transfer them elsewhere. I will continue to discuss the tradingview platform in daily videos as I think that it is currently the best way to chart the “big three.”
From Friday’s close at SPY 333.48 there is a +/-5.476EM into this coming Friday; this is larger than the four-day 4.039 EM from last week. The EM targets for this Friday’s close are 338.96 to the upside, and 328.00 to the downside.
A lot of energy still coursing in these markets. For the first time since late January, the lower EM was blown out last week. Notice how the price CLOSED right at the lower Weekly EM on Friday.
I have the following positions in play:
- SPY 21FEB 319/320 debit put spread (1/22) entered for $.11 debit and expired OTM. I was too aggressive with my profit target as this trade got up to about a $.35 exit on 1/31.
- SPY 13MAR 328/323 debit put spread (2/12) entered for $.66 debit. I would like to see a 100% return from this trade.
No additional trades at this time.
The scan that I discussed in the 8/4/2018 video is available to download for thinkorswim here: http://tos.mx/OvdVnz I will also be adding a second Larry Connors scan to this section as well; here is the Connors Crash scan: http://tos.mx/BhHuKL
I have the following positions in play at this time:
- XLF 6MAR 31/32 debit call spread (2/6) was added for a $.45 debit. I will look for a 50% return.
- FB 13MAR 212.5/215 debit call spread (2/10) was added for a $1.18 debit. I will look for a 50% return.
- INTC 20MAR 65/67.5 debit call spread (2.18) was added for a $1.25 debit. I will look for a 50% return.
- GDX 20MAR 29/31 debit call spread (2/20) was added for an $.86 debit. I will look for a 50% return,
No additional trades at this time.
The “Hindenburg Strategy” is meant to capture “value” from successive corrections that lead up to the final “death spiral” with a Bear Market. The basic principle is to buy 3-month out long puts on the SPY, and to finance those puts by the sale of credit spreads. The timing on these credit spreads has been nearly impossible to determine with today’s declining-rate environment, and we might be in the process of one final mighty blow-off.
I will continue to buy long puts into extreme upside strength.
I have no open positions at this time.
- SPY 21FEB 279 long puts (11/15) entered for $2.21 debit expired worthless on Friday. In retrospect, the rally was just getting started when we added this position.