
Daily Market Newsletter
July 17, 2018Non-Directional Strategies
Semi-Directional Strategies
Directional Strategies
Bitcoin/Crypto
View Doc's New Book
July Expiration
Day(s)
:
Hour(s)
:
Minute(s)
:
Second(s)
Market Commentary
I had written yesterday, “The number of bearish articles being published today makes me feel as if we’ll see the exact opposite occur. But this is why we cannot trade off of OPINION, but rather what PRICE is doing.” A super-strong day on Tech as the NASDAQ futures rallied 1.3% higher and AMZN set new highs. Netflix was the goat last night by missing their earnings target, but traders snapped up the 15% discount under the assumption that “they never miss twice.”
All of the companies that we watched for earnings today did well, other than UNH.
Jerome Powell was on the hotseat today in front of Congress. Nothing that he said was notable other than he feels that further interest rate hikes are warranted due to expected growth of the economy; that did nothing but add fuel to the fire today. Every dip will be bought until they’re not…but the last dip will come on overall great news, and not the massive skepticism that we’re seeing now.
Continuing this week we have the following earnings events to watch for:
- Wednesday: IBM, MS, ABT
- Thursday: MSFT, TRV
- Friday: GE
Large cap tech earnings are in the last two weeks of July with GOOGL 7/23, FB 7/25, AMZN 7/26, and AAPL 7/31.
The scan for the “Cheap Stocks with Weeklys” is available here.
The RSI(2) FE scan is available here.
The current MAIN “high liquidity” watchlist that I’m scanning against in thinkorswim is available here.
The latest crypto video (Cryptocurrency Market Visualized) is available here
Please sign up for our free daily crypto report here.
If you need a video link with an embedded player you can use this link.
Offensive Actions
Offensive Actions for the next trading day:
- No trades for tomorrow.
Defensive Actions
Defensive actions for the next trading day:
- Any vertical, butterfly, or diagonal debit spreads that we set up are risk-managed from day one, and no defense is really required.
- Closing orders have been entered for all new spreads.
- A test of the 200 day SPX moving average would cause an exit from the Hindenburg strategy; see below.
Strategy Summary Graphs
Each graph below represents a summary of the current performance of a strategy category. For an explanation of what the graphs mean, watch this video.
Non-Directional Strategies
Semi-Directional Strategies
Directional Strategies
%
%
%
Technical Analysis Section
Market Internals: Volume was average today and breadth ended the day relatively strong with +191 advancers minus decliners
SPX Market Timer : The Intermediate line rose further into the Upper Reversal Zone, still showing a bullish bias. This chart is showing a strong bearish cluster for the third day in a row with the two strongest timeframes clustered in the Upper Reversal Zone; this can be a leading signal for a pause, however in the past it has usually led to several days of bearish cluster as the price runs away.
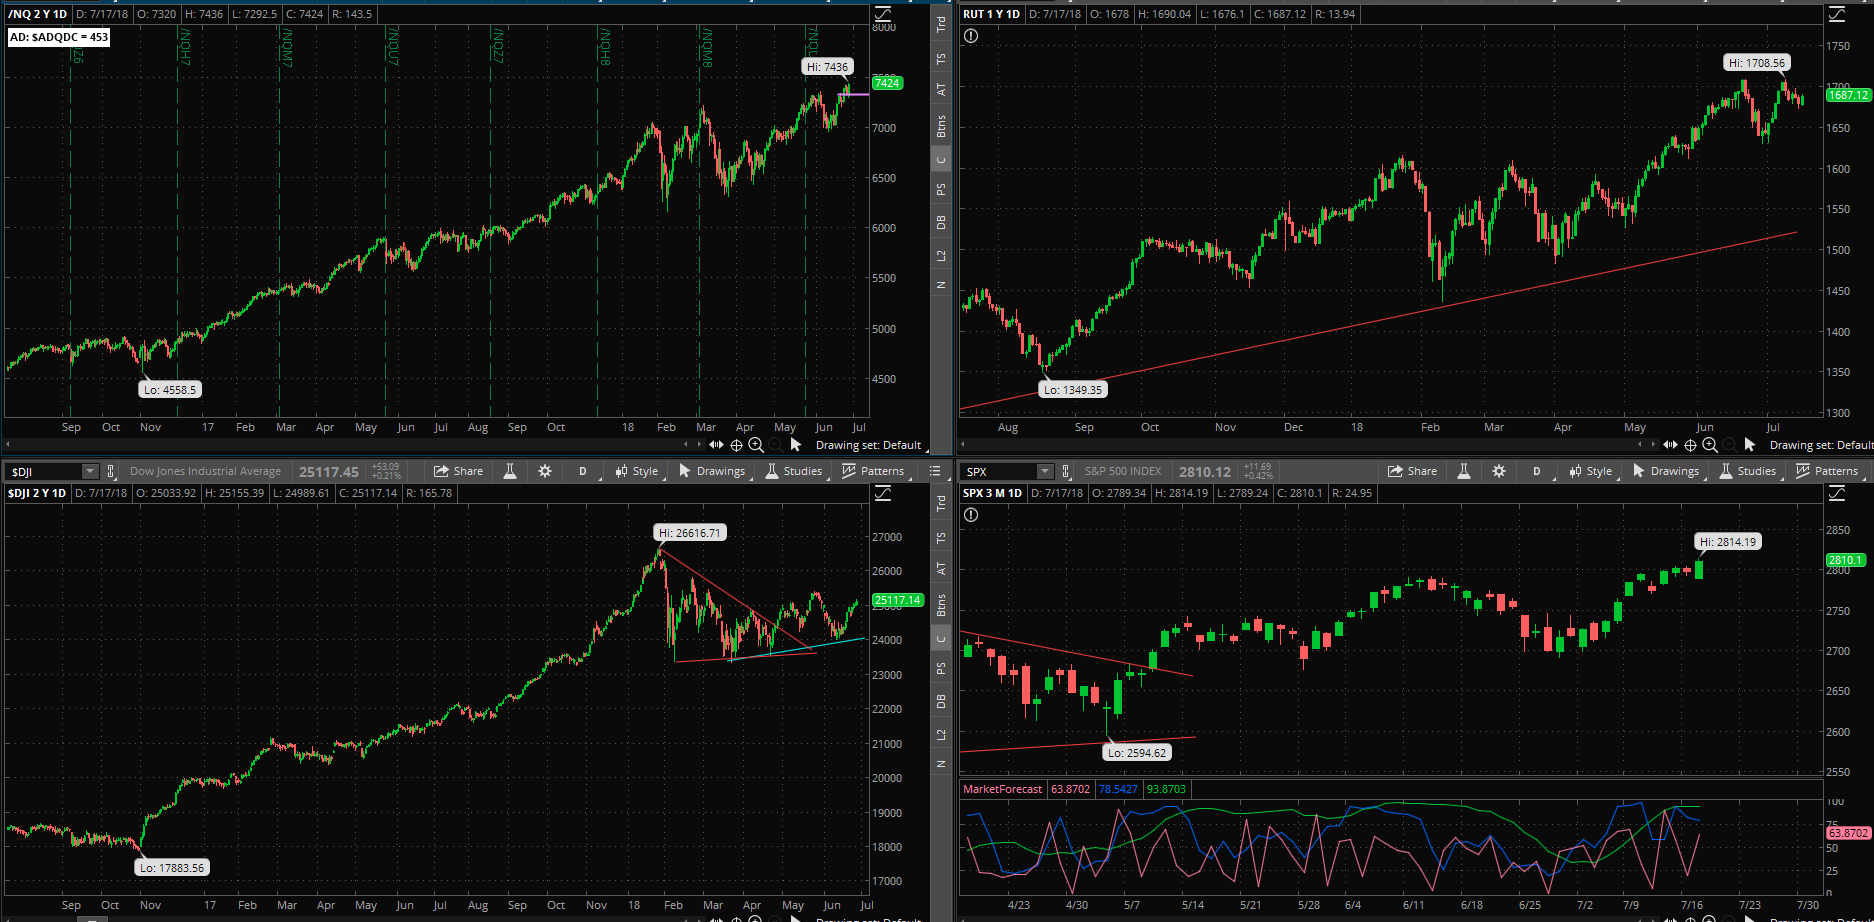
DOW Theory: The SPX is in a long term uptrend, an intermediate uptrend, and a short-term uptrend. The RUT is in a long-term uptrend, an intermediate uptrend, and a short-term uptrend. The Dow is in an intermediate downtrend and short-term uptrend.
VIX: The VIX fell to 12.03 after peaking at 50.3 five months ago, back inside the bollinger bands. The RVX fell to 14.02 and is inside the bollinger bands.
Fibonacci Retracements: The price has retraced 38.2% of the election rally; so far this has been a garden-variety correction.
Support/Resistance: For the SPX, support is at 2600 … with overhead resistance at 2878. The RUT has support at RUT 1530 with overhead resistance at 1708. All three major index charts that we follow are now showing a Golden Cross with the 50 day moving average crossing above the 200 day average.
Fractal Energies: The major timeframe (Monthly) is above exhaustion, with a reading of 50, almost fully-charged. The Weekly chart is just below fully charged with an energy reading of 46. The Daily chart is showing a level of 40 which is just above exhaustion due to the linear upside trend. Markets are doing PRECISELY what they must in order to restore energy that has been incredibly depleted. Extreme Range Expansion leads to extreme range contraction (big swings).
Other Technicals: The SPX Stochastics indicator rose to 78, almost overbought. The RUT Stochastics indicator rose to 69, mid-scale. The SPX MACD histogram rose above the signal line, showing a return of upside momentum. The SPX is back inside the Bollinger Bands with Bollinger Band support at 2687 and resistance at the upper band at 2823 and price is below the upper band. The RUT is back inside the Bollinger Bands with its boundaries at 1637 to 1717 and price is below the upper band. We recently saw the market reaching into a full “runaway” condition, where “fear of missing out” means abandoning any former patience and “wait for the dip” strategy. This usually occurs near the top of the intermediate move. Markets are about to release from the sideways/volatile correction.
Position Management – NonDirectional Trades
I have no positions in play at this time:
Our next offensive cycle will commence when either 1) the price continues to rally and hits daily exhaustion, or 2) we see the price sell off from this level and we hit an exhaustion level on the downside move, allowing us to enter put spreads.
I don’t see an entry on this strategy for at least a couple of weeks at the soonest; there is more potential for MOVEMENT than there is for consolidation as we’re seeing this week.
I have no positions at the current time.
No setup at this point; we need to be very selective. I would not sell LP Condors if we go back into corrective mode. If the S&P stays in “quiet & trending” mode then we’ll look for the next daily exhaustion reading.
I have no remaining positions. Calendar spreads are good for markets in quiet/trending character, so there is a good shot that we can start to play these again.
The calendar spread tracking sheet is available for your download here. Yes, if you follow the math in the sheet, all of the numbers account for commissions in and out of the trade. Please note: If you trade these positions please keep the size small, to the point where you “do not care” about the success or failure of this position.
I am targeting stocks using short puts/covered calls that offer a much lower absolute risk point, where in event of crash we can almost define our total risk by the price of the underlying. While this is not how I intend to manage risk in these positions, I view this as fundamentally more solid than trying to actively manage risk on assets that are going for $$$hundreds which have also gone parabolic. I have the following positions in play:
- VXX Stock – I own 12 shares of this stock and will hold until Armageddon occurs.
- SLV Stock – I have 1000 shares of the SLV that was assigned at the $15 level. I currently have 17AUG $16.50 SLV calls (6/8) for $24 credit. .
- BAC – I sold the 17AUG $27 puts (6/18) for $.34 credit. I closed these out (7/17) for $.05 giving me a gross profit of $29/contract.
No entries at this time.
Position Management – Directional Trades
Thoughts on current swing strategies:
- 8/21 EMA Crossover – No current positions; the next crossover is showing right now. I will wait on a pullback to the 8ema before entering.
- RSI(2) CounterTrend – Looking for the next setup.
- Daily S&P Advancers – if I see the number of daily S&P500 advancers drop into single digits near the close of any trading day, I will go long shares of the SSO.
- Swing – I entered a GLD 20JUL 128/129 call spread for $.40 (4/12) and will hold this for the eventual breakout.
The crypto market has seen a little pop to the upside since last weekend; I believe that this is only to relieve oversold pressure and bears will reload once again soon. There has been no capitulation yet. .
Investors should currently be looking to find technical entries to warehouse BTC/ETH/LTC assets for eventual trades on Alt-coins. You should also be looking to devices like “trezor” or other cold-storage devices to keep your assets off of the network, or other secure wallet such as Navcoin. Relying on the security of your broker is no longer good enough; no one can log into your ETrade account and “steal” your stock assets, but the whole nature of Cryptocurrencies and their portability means that someone can grab your assets and transfer them elsewhere. I will continue to discuss the tradingview platform in daily videos as I think that it is currently the best way to chart the “big three.”
Viewing the SPY from the Friday closing price at 279.59, there is a +/-2.99 EM into this coming Friday. This is smaller than last week’s 3.436 EM, which shows that the trend has been towards a decreasing EM.
The EM targets for this Friday’s close is 282.58 to the upside, and 276.60 to the downside.
The upper EM for the SPY was blown through last week; we felt that this would be the case which is why we set up the Long Iron Condor below. . There were very specific reasons why I felt that an EM fade was a poor idea this week, and we’re seeing that.
Last week I showed that the EM targets for 20JUL are at the 270.12 and 280.72 levels. Once again we got somewhat of a lousy entry after last weekend’s newsletter call, as the S&P gapped up several points on Monday morning. If we can see the SPY rise another 2 points this week, which is less than the EM calls for…we should achieve our target profit.
I have the following positions in play per last weekend’s advisory:
- 20JUL SPY 272/273*281/282 Long Iron Condor – filled (7/9) for $.15 on the puts and $.15 on the calls. I will look for a 200% return on the “winning” side to pay for the trade.
I have no current positions. I will consider setting up another ratio fly as price approaches resistance:
Entry criteria are:
- Using calls
- 17 to 50 calendar days
- center strike .25 to .40 delta
- ratio is 1/3/2 quantity, from the bottom, calls are long/short/long
We will exit the spread at a 60-70% level of credit received. The max risk on the trade is defined on the graph if the price goes much higher. There are no early exits, only exiting the week of expiry to avoid assignment. Also avoid dividend periods. I am currently trialing some trades and will discuss them in the newsletter; after a few cycles, I will start adding these trades to circulation. TOS scan code: http://tos.mx/hvWmMl
I have the following positions:
- XLB 10AUG 58.5/60.5 call vertical (7/11) entered for $.91 debit. I will look for a 50% return from this trade.
- XRT 17AUG 49/51 call vertical (7/17) entered for $1.02 debit. I will look for a 50% return from this trade.
I saw a break above the descending trendline that we discussed in Monday’s report, so I entered the XRT trade today.
The “Hindenburg Strategy” is meant to capture “value” from successive corrections that lead up to the final “death spiral” with a Bear Market. The basic principle is to buy 3-month out long puts on the SPY, and to finance those puts by the sale of credit spreads. Frankly, selling the “financing” trades has been a huge challenge in this low-vol environment. I will only sell put spreads on decent pullbacks that allow me to secure put spreads 10% OTM
- I entered the 17AUG SPY 245 puts (5/14) for a $1.41 debit. I will hold these through the next test of the 200 dma.