
Daily Market Newsletter
January 3, 2019Non-Directional Strategies
Semi-Directional Strategies
Directional Strategies
Bitcoin/Crypto
View Doc's New Book
January Expiration
Day(s)
:
Hour(s)
:
Minute(s)
:
Second(s)
Market Commentary
We woke up to the futures being down another 45 handles on the S&P500 again this morning, but for those that thought that today would be a repeat of yesterday’s bounce, something else was in store. AAPL issued a warning last night based on weakness in China, and they dropped about 10% of their value in one day. I believe that we are going to continue to see these types of reports in the “confessional” in the near future as 4Q earnings reports approach in a couple of weeks. .
In today’s video I’ll look back over the last couple of decades to see if there is a precedent for a re-test of a panic bottom in less than one month. So far what we’re seeing is a standard pullback to a higher low, but anything can happen in the near term with this much emotion, and we need to be prepared for it.
My forecast for the first half of 2019 is to see a re-test of the recent panic bottom in the next month or so, and then a relatively strong rally leg for about 2-3 months which will retrace to roughly the SPX 2600-2700 level, ringing the “all-clear” bell….at which point the second leg will kick in, and will be much worse than this initial leg. This is not me predicting the future, but rather extrapolating how previous Bear markets have played out.
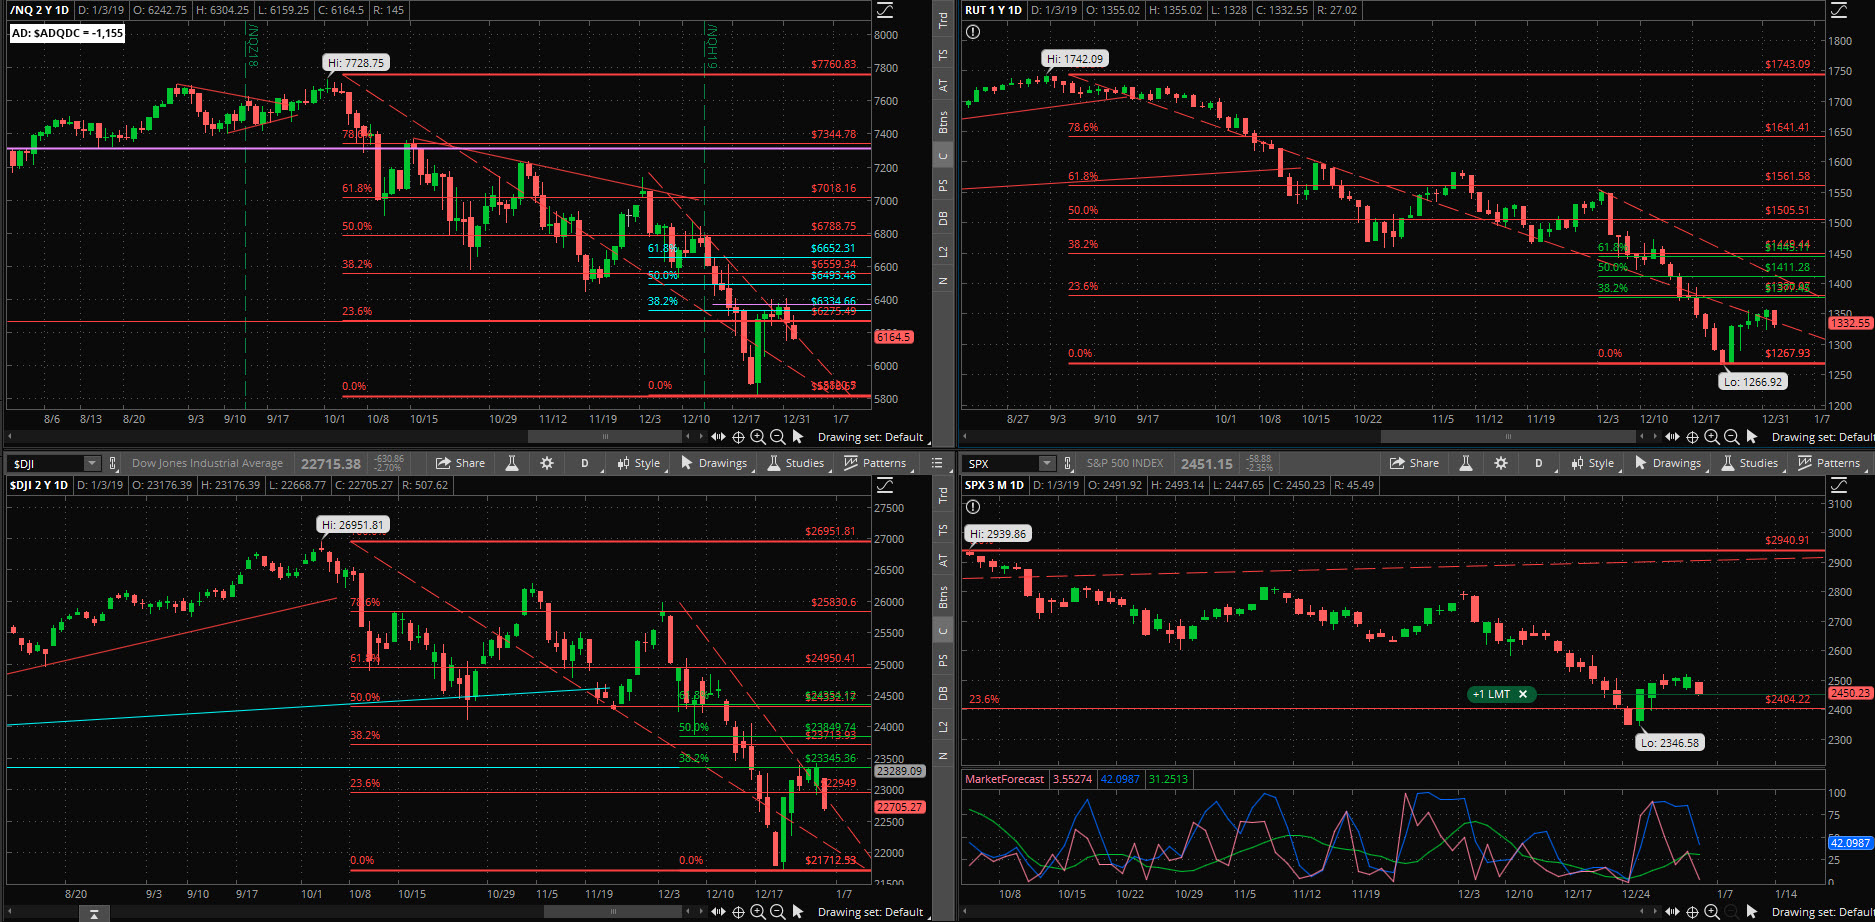
Here is the current scorecard for the correction from the September 2018 highs:
- S&P is down ~594 points or 20.20%
- Dow is down 5239 points or 19.44%
- /NQ is down 1908 points or 24.69%
- RUT is down 475 points or 27.27%
What is our approach to trading this market, which has now moved into a “Volatile/Trending” character?
- Sell credit spreads/create iron condors on the SPX into relative extremes, beyond the current range of movement.
- Establish long iron condors when the price shows potential of moving a great distance in the near future.
- Exercise caution with long stocks/short puts since the 50/200 death cross has hit each index
- Look to establish debit spread-based swing trades against sentiment extremes, and/or EM boundaries
- Use short-term long options to play within the intraday volatility
Please sign up for our free daily crypto report here.
An embedded flash video is available here.
Offensive Actions
Offensive Actions for the next trading day:
- No new trades tomorrow.
Defensive Actions
Defensive actions for the next trading day:
- Any vertical, butterfly, or diagonal debit spreads that we set up are risk-managed from day one, and no defense is really required.
- Closing orders have been entered for all new spreads.
- I will look for a bounce in the near future to clear the call spreads on our Long Condors.
Strategy Summary Graphs
Each graph below represents a summary of the current performance of a strategy category. For an explanation of what the graphs mean, watch this video.
Non-Directional Strategies
Semi-Directional Strategies
Directional Strategies
%
%
%
0
Technical Analysis Section
Market Internals: Volume was less-than-average today and breadth ended the day very weak at -325 advancers minus decliners, from the low point of the day at -378 advancers.
SPX Market Timer : The Intermediate line flattened above the Lower Reversal Zone, now showing a neutral bias. No leading signals at this time.
DOW Theory: The SPX is in a long term uptrend, an intermediate downtrend, and a short-term uptrend. The RUT is in a long-term uptrend, an intermediate downtrend, and a short-term uptrend. The Dow is in an intermediate downtrend and short-term uptrend.
VIX: The VIX rose to 25.03 after peaking at 50.3 eleven months ago, back inside the bollinger bands. The RVX rose to 28.41 and is back inside the bollinger bands.
Fibonacci Retracements: Now we can start to track the bounce retracement of the SPX swing down from 2800; the 38.2% retracement is at the 2520 level and that was hit on Friday. A much more important confluence level is at the SPX 2575 level. In today’s video I will look at the fib levels on the bounce back up as well.
Support/Resistance: For the SPX, support is at 2350 … with overhead resistance at 2800 and 2941. The RUT has support at RUT 950 with overhead resistance at 1553. The S&P500, Russell 2000, Dow, and Nasdaq 100 have all printed a Death Cross with the 50ma crossing below the 200ma; this can be a leading signal for a true Bearish move.
Fractal Energies: The major timeframe (Monthly) is charged again, with a reading of 56. The Weekly chart has an energy reading of 42, almost at exhaustion. The Daily chart is showing a level of 40 which is just above exhaustion from the swing down. I find it surprising that the monthly chart is even starting to pick up on the downtrend. We were seeing all three timeframes showing big levels of potential energy in early December and this is what happens when all that energy has to find a place to go.
Other Technicals: The SPX Stochastics indicator rose to 28, above oversold. The RUT Stochastics indicator rose to 24, above oversold. SPX MACD histogram rose above the signal line, showing a return of upside momentum. The SPX is inside the Bollinger Bands with Bollinger Band support at 2356 and resistance at the upper band at 2739 with price is above the lower band. The RUT is back inside the Bollinger Bands with its boundaries at 1257 to 1504 and price is above the lower band.
Position Management – NonDirectional Trades
I have the following positions in play:
- SPY 04JAN 257/258*281/282 Long Iron Condor (12/7) entered for $.18 debits on both the puts and calls, for a total trade debit of $.36. I cleared the put spreads at target $.54 credit (12/17) and will the opposite side call spreads in play to remove as the volatility allows it. These call spreads will expire tomorrow but we’ve already assured a profit on the trade.
- SPY 11JAN 247/248*270/271 Long Iron Condor (12/17) entered for $.17 debit on the call spreads and $.18 debit on the put spreads. I closed the put vertical spreads (12/20) for a $.54 credit. I will keep the call spreads in play to look for any kind of positive credit.
- SPY 19JAN 232/233*262/263 Long Iron Condor (12/21) entered for $.17 debits on the puts and calls. I have placed $.51 GTC credit orders on each “side” of the trade so that if one side fires at a profit target, I will retain the other side for a bounce.
- SPY 25JAN 231/232*266/267 Long Iron Condor (12/28) entered for $.18 debits on the puts and calls. I have placed $.54 GTC credit orders on each “side” of the trade.
- SPX 15FEB 2150/2140 put credit spread (12/20) entered for $.80 credit. I will close this position if the delta of the short option hits .45; it is currently showing a delta of .07 on the short option. My target closing debit will be $.10.
We are scoring good returns on the long condors and our risk is very limited in this extreme volatility. The volatility appears to be coming in somewhat over the last couple of days; this is very normal after the panic low.
The big opportunity for us would be a relief rally where we could clear our call spreads from the long condor inventory that we hold.
I have been adding long condor inventory on Fridays lately to anticipate the big Monday moves, however I think I have enough inventory for now.
We do have one short put spread on the SPX at what I believe would be an unattainable level for this first swing down, but we will manage it by the numbers. I would consider filling a FEB SPX 2820/2830 call spread as long as I could secure an $.80 credit. I am unlikely to fill that order unless we see a huge bounce higher.
This strategy works best with a quiet/trending market, and not with a sideways/volatile or trending/volatile one that we’re currently seeing.
I have no remaining positions. Calendar spreads are good for markets in quiet/trending character, so we’ll want to wait for that type of price action to show again. The calendar spread tracking sheet is available for your download here. Yes, if you follow the math in the sheet, all of the numbers account for commissions in and out of the trade. Please note: If you trade these positions please keep the size small, to the point where you “do not care” about the success or failure of this position.
With three out of the four major indices in a death cross, I am suspending additional short put selling until those signals clear. I have the following positions in play:
- SLV Stock – I have 1000 shares of the SLV that was assigned at the $15 level. I opened up new short calls for the 15FEB cycle at SLV $15 calls, securing a $.23 fill (12/28).
- SSO – I sold the SSO 15FEB $65 puts (12/21) for a $1.15 credit. I will look to close these positions for a $.05 debit.
- HPE – I was assigned 500 shares in the DEC2018 cycle and my initial cost basis on this position is $13.78/share. I sold the 15FEB $14 calls (12/24) for a $.23 credit.
- BAC – I sold 18JAN $24 puts (11/19) for a $.25 credit and looking to close for $.05. Will need to close these on the next bounce up.
No additional entries at this time due to the death cross.
The recent trades were relatively small positions that would create a discount entry should I be assigned. Our priority at this point is to close our open positions and ride out the storm until conditions improve. With that said, if I see truly epic selling that allows me to secure puts at levels where I would be an enthusiastic buyer, I will take those trades. At the very least we would need to wait on Daily/Weekly exhaustion levels.
Position Management – Directional Trades
Thoughts on current swing strategies:
- 8/21 EMA Crossover – Looking for the next signal.
- RSI(2) CounterTrend – Looking for the next setup. Lots of these showing now, best to play these during primary uptrend.
- Daily S&P Advancers – Per the 12/24 Trade Update I bought shares of the SSO at $84.35/share (12/24). I will sell this position at SSO 100, or when the RSI(14) hits the 70 level, whichever occurs first. I do not have a “stop loss” on this position.
- Swing – Per Wednesday’s advisory I added the SPY 30JAN 247/248 debit put spread (1/3) for a $.42 debit. I did not get the best fill on this position because the S&P’s were already down 30+ handles after Wednesday night’s sell-off, but I’m glad to have better downside protection. I will look for a 50% return from these spreads.
Crypto markets have been strong when equities are weak; it appears like they might be negatively correlated and could create some important opportunities for us in 2019 if the equities market takes a dump.
Investors should currently be looking to find technical entries to warehouse BTC/ETH/LTC assets for eventual trades on Alt-coins. You should also be looking to devices like “trezor” or other cold-storage devices to keep your assets off of the network, or other secure wallet such as Navcoin. Relying on the security of your broker is no longer good enough; no one can log into your ETrade account and “steal” your stock assets, but the whole nature of Cryptocurrencies and their portability means that someone can grab your assets and transfer them elsewhere. I will continue to discuss the tradingview platform in daily videos as I think that it is currently the best way to chart the “big three.”
Viewing the SPY from the Friday closing price at 247.75, there is a +/-8.427 EM into this coming Friday. This is about the same as last week’s 8.935 EM. The EM targets for this Friday’s close are 256.18 to the upside, and 239.32 to the downside.
Last Friday saw the first time in recent weeks that the EM level was respected at the end of the week. Keep in mind that we only have four trading days this week. I do not expect to see either EM level hit by tomorrow but anything could happen.
My conclusion after recent experience is that this strategy is best reserved for stocks experiencing a snap-back rally in a primary bear trend, which we magically now have. I would like to remain patient for this snap-back rally as it could be intense.
We will look for the next bounce back up on the indices to start playing directional bear spreads
The scan that I discussed in the 8/4/2018 video is available to download for thinkorswim here: http://tos.mx/OvdVnz I will also be adding a second Larry Connors scan to this section as well; here is the Connors Crash scan: http://tos.mx/BhHuKL
I have no positions at this time.
No other entries at this point. I would prefer to see the market stabilize first before looking long again. We will see big volatility over the next two+ months. If we are able to secure a “higher low” off of the S&P in the short run, this might be a good environment for a couple of weeks.
The “Hindenburg Strategy” is meant to capture “value” from successive corrections that lead up to the final “death spiral” with a Bear Market. The basic principle is to buy 3-month out long puts on the SPY, and to finance those puts by the sale of credit spreads.
I have no positions at this time. I cleared out the current puts on the drop to the 200ma. I will “reload” again on the next bounce up to SPX 2574.