
Daily Market Newsletter
August 6, 2018Non-Directional Strategies
Semi-Directional Strategies
Directional Strategies
Bitcoin/Crypto
View Doc's New Book
August Expiration
Day(s)
:
Hour(s)
:
Minute(s)
:
Second(s)
Market Commentary
Another “mutual fund Monday” as nearly every S&P sector was up fractionally, in a very typical “groundhog day” move that we’ve seen…well, for years. GS and MS raised GDP outlooks and it looks like so far, the trade wars have been put in the past.
My approach going forward will be to overall look for “long” plays, but also to mix in some non-directional as we have done with the Condors….and also some bearish trades as I talked about in this weekend’s video. See the “Synthetic Shorts” section below.
The scan for the “Cheap Stocks with Weeklys” is available here.
The RSI(2) FE scan is available here.
The current MAIN “high liquidity” watchlist that I’m scanning against in thinkorswim is available here.
The latest crypto video (Cryptocurrency Market Visualized) is available here
Please sign up for our free daily crypto report here.
For an embedded video player version of today’s market video, please click here.
Offensive Actions
Offensive Actions for the next trading day:
- Watch for the lower EM fade this week.
Defensive Actions
Defensive actions for the next trading day:
- Any vertical, butterfly, or diagonal debit spreads that we set up are risk-managed from day one, and no defense is really required.
- Closing orders have been entered for all new spreads.
- A test of the 200 day SPX moving average would cause an exit from the Hindenburg strategy; see below.
- I will close the RUT Iron Condor if we see the RUT price rise above the 1700 level.
- I will take an exit on the XLB spread tomorrow; see “whale” section below.
Strategy Summary Graphs
Each graph below represents a summary of the current performance of a strategy category. For an explanation of what the graphs mean, watch this video.
Non-Directional Strategies
Semi-Directional Strategies
Directional Strategies
%
%
%
Technical Analysis Section
Market Internals: Volume was below-average today and breadth ended the day modestly higher at +148 advancers minus decliners.
SPX Market Timer : The Intermediate line rose into the Upper Reversal Zone, now showing a bullish bias. The two stronger timeframes are in the Upper Reversal Zone, creating the Strong Bearish Cluster after the relatively rare full bearish cluster was seen on Friday. We have seen this signal on occasion and it does not typically generate an immediate reversal to the downside.
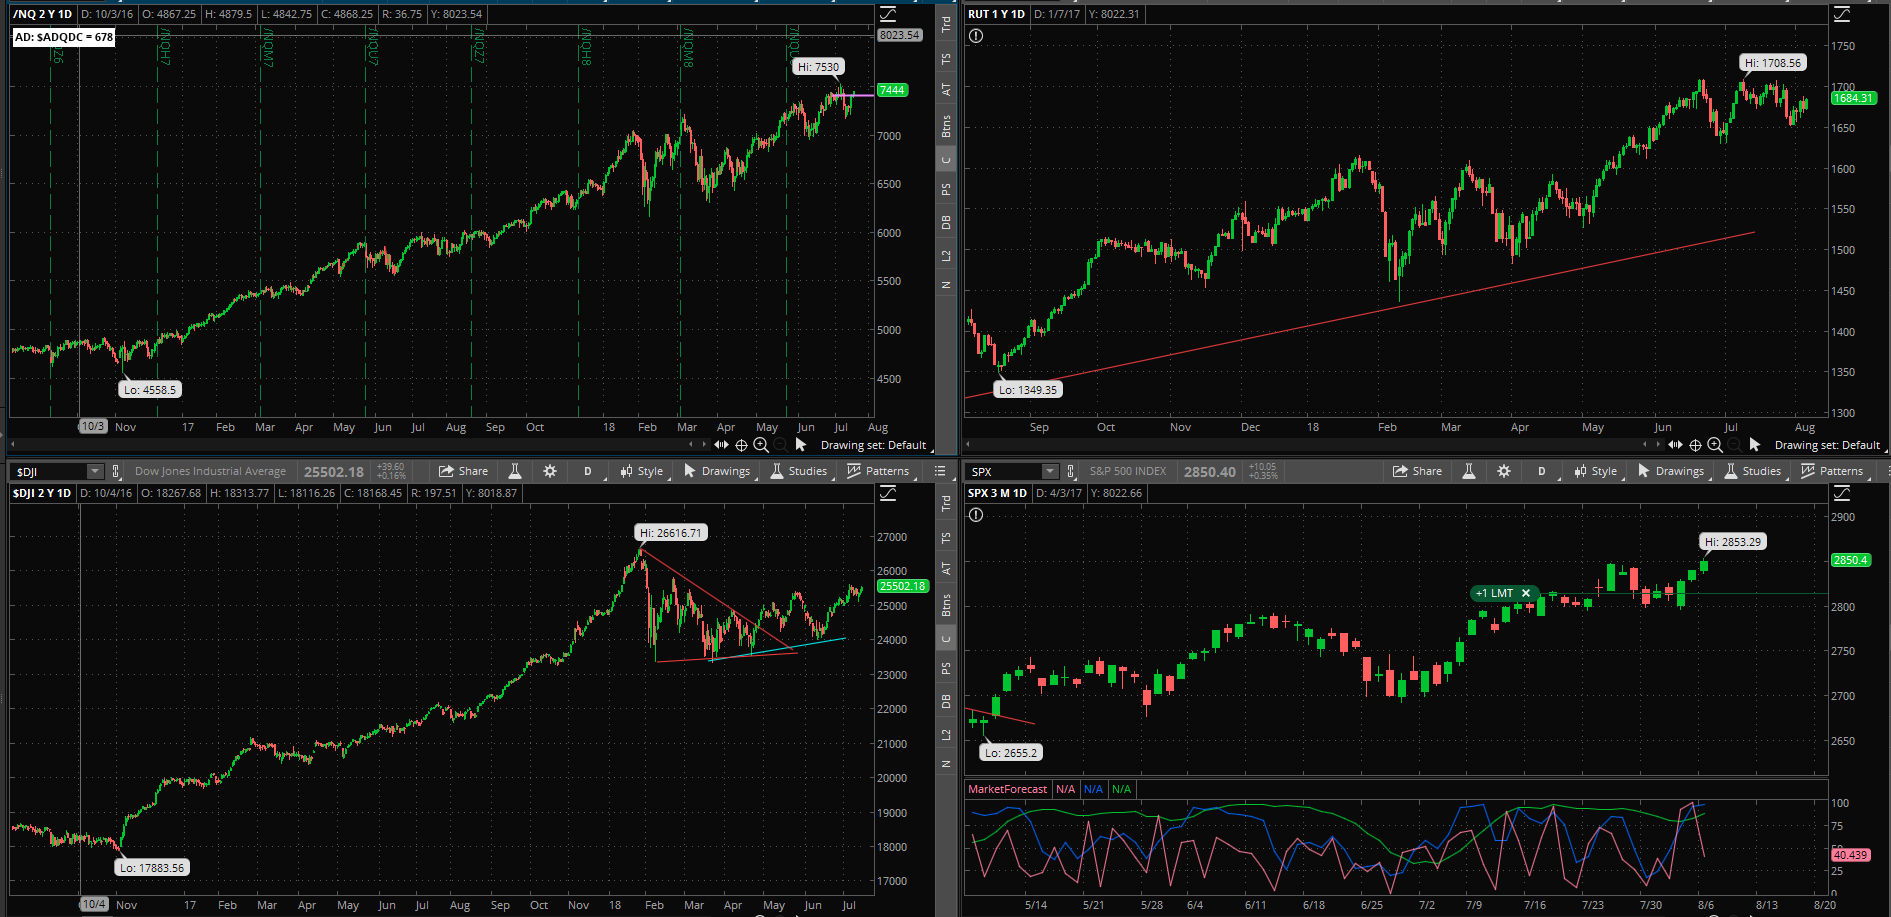
DOW Theory: The SPX is in a long term uptrend, an intermediate uptrend, and a short-term uptrend. The RUT is in a long-term uptrend, an intermediate sideways trend, and a short-term uptrend. The Dow is in an intermediate uptrend and short-term uptrend.
VIX: The VIX fell to 11.27 after peaking at 50.3 five months ago, back inside the bollinger bands. The RVX flattened to 14.44 and is inside the bollinger bands.
Fibonacci Retracements: The price has retraced 38.2% of the election rally; so far this has been a garden-variety correction.
Support/Resistance: For the SPX, support is at 2700 … with overhead resistance at 2878. The RUT has support at RUT 1630 with overhead resistance at 1708. All three major index charts that we follow are now showing a Golden Cross with the 50 day moving average crossing above the 200 day average.
Fractal Energies: The major timeframe (Monthly) is almost recharged again, with a reading of 52. The Weekly chart is above exhaustion with an energy reading of 44. The Daily chart is showing a level of 59 which is fully recharged due to the recent chop.
Other Technicals: The SPX Stochastics indicator flattened at 64, mid-scale. The RUT Stochastics indicator fell to 37, mid-scale. The SPX MACD histogram rose above the signal line, showing a return of upside momentum. The SPX is inside the Bollinger Bands with Bollinger Band support at 2777 and resistance at the upper band at 2851 and price is at the upper band. The RUT is back inside the Bollinger Bands with its boundaries at 1659 to 1708 and price is above the lower band. We recently saw the market reaching into a full “runaway” condition, where “fear of missing out” means abandoning any former patience and “wait for the dip” strategy. This usually occurs near the top of the intermediate move. Markets are about to release from the sideways/volatile correction.
Position Management – NonDirectional Trades
I have the following positions in play:
- RUT 21SEP 1580/1590*1790/1800 Iron Condor (7/23) entered for $2.00 credit. My exits will be if 1) we’re able to buy back the condor for $1.00, 2) we are within 30 days of 21 September, 3) the short call hits .35 delta, or 4) the short put hits .45 delta. Quite honestly, if the price hits 1700 we should bail as we’re starting to see coiling in the RUT.
This trade is doing great for now but we’ll need to close it down no later than August 21st. I show a buy-back of $1.20 so we’re close to our profit goal.
I have the following positions:
- SPX 24AUG 2775/2780*2855/2860 Iron Condor (7/30) was entered for a $2.50 credit. I will look for a 25% return on risk from this position.
The last three days of price action has pushed the price higher into the profitable range and away from the T+0 profit peak; this delays any potential early exit and might have to go the distance on this one if the price continues grinding.
I have no remaining positions. Calendar spreads are good for markets in quiet/trending character, so there is a good shot that we can start to play these again.
The calendar spread tracking sheet is available for your download here. Yes, if you follow the math in the sheet, all of the numbers account for commissions in and out of the trade. Please note: If you trade these positions please keep the size small, to the point where you “do not care” about the success or failure of this position.
I am targeting stocks using short puts/covered calls that offer a much lower absolute risk point, where in event of crash we can almost define our total risk by the price of the underlying. While this is not how I intend to manage risk in these positions, I view this as fundamentally more solid than trying to actively manage risk on assets that are going for $$$hundreds which have also gone parabolic. I have the following positions in play:
- VXX Stock – I own 12 shares of this stock and will hold until Armageddon occurs.
- SLV Stock – I have 1000 shares of the SLV that was assigned at the $15 level. I currently have 17AUG $16.50 SLV calls (6/8) for $24 credit. .
No entries at this time; I’d like to see a decent pullback before we go shopping again for new candidates.
Position Management – Directional Trades
Thoughts on current swing strategies:
- 8/21 EMA Crossover – No current positions.
- RSI(2) CounterTrend – Looking for the next setup.
- Daily S&P Advancers – if I see the number of daily S&P500 advancers drop into single digits near the close of any trading day, I will go long shares of the SSO.
- Swing – Looking for the next setup.
The crypto market has been very soft the last few days and many bear flags have been broken; BTC is still holding strong but cannot hold up the entire market by itself. The bear market and strong weekly downtrends look to be having their effect.
Investors should currently be looking to find technical entries to warehouse BTC/ETH/LTC assets for eventual trades on Alt-coins. You should also be looking to devices like “trezor” or other cold-storage devices to keep your assets off of the network, or other secure wallet such as Navcoin. Relying on the security of your broker is no longer good enough; no one can log into your ETrade account and “steal” your stock assets, but the whole nature of Cryptocurrencies and their portability means that someone can grab your assets and transfer them elsewhere. I will continue to discuss the tradingview platform in daily videos as I think that it is currently the best way to chart the “big three.”
Viewing the SPY from the Friday closing price at 283.60, there is a +/-2.867 EM into this coming Friday. This is significantly smaller than last week’s 3.525 EM, which shows the impact of getting major risk events out of the way.
The EM targets for this Friday’s close is 286.47 to the upside, and 280.73 to the downside.
With a lot of short-term energy available on the daily chart and a small EM, this week does not present a good fade opportunity to the upside, however it might be a good one for the downside EM target..
This is a new section for this newsletter; I would like to start to carefully build some bearish positions that would be the virtual opposite of a covered call, yet I will use deep ITM long puts as the short stock substitute, and write short covered puts against those long puts.
I would like to add one additional consideration to the criteria, in that I’d like to see the price print a “lower high” first on the daily chart. Otherwise what is “high” can go “higher” as we’ve seen repeatedly over the years.
I will also publish the criteria for managing the short and long positions with this strategy. This is definitely counter-trend for now but might prove to be valuable down the road.
The scan that I’ll discuss in the 8/4/2018 video is available to download for thinkorswim here: http://tos.mx/OvdVnz
I will also be adding a second Larry Connors scan to this section as well.
I have the following positions:
- XLB 10AUG 58.5/60.5 call vertical (7/11) entered for $.91 debit. I will look for a 50% return from this trade; I will have to close this on the next move higher.
- XRT 17AUG 49/51 call vertical (7/17) entered for $1.02 debit. I will look for a 50% return from this trade. If the price hits the $51 level and gets stuck there, let’s exit the trade rather than fight overhead supply.
- XLF 7SEP 28/29 call vertical (8/6) entered for $.46 debit; I will look for a 50% return from this trade.
We need to close out the XLB trade tomorrow; we are out of time on this trade and it’s showing a positive return, or at least it was at one point today. The gamma is too high and we’ll see wild fluctuations in the next couple of days. We could always roll the position if we still believed in it.
The “Hindenburg Strategy” is meant to capture “value” from successive corrections that lead up to the final “death spiral” with a Bear Market. The basic principle is to buy 3-month out long puts on the SPY, and to finance those puts by the sale of credit spreads. Frankly, selling the “financing” trades has been a huge challenge in this low-vol environment. I will only sell put spreads on decent pullbacks that allow me to secure put spreads 10% OTM
- I entered the 17AUG SPY 245 puts (5/14) for a $1.41 debit. I will hold these through the next test of the 200 dma.
If the price continues grinding higher, I will add the next series of long puts after August expiration.