

Daily Newsletter
December 12, 2019Non-Directional Strategies
Semi-Directional Strategies
Directional Strategies
Bitcoin/Crypto
View Doc's New Book
December Expiration
Day(s)
:
Hour(s)
:
Minute(s)
:
Second(s)
Market Commentary
Markets roared higher today, the S&P closing up almost a percent which at these heights, is pretty strong. And it was all based on…TRADE DEAL yet again. The same tired phrase for the past two years is still moving markets. Another minor issue was the US Government funding itself again. FOMC out of the way, trade deal likely, no government interference….all of this points to “certainty” and that usually propels markets higher.
Technically, we are seeing the S&P approach exhaustion on the weekly and daily timeframes now. It’s unlikely that we’ll see a strong “Santa” run because of this but price can override technicals any time that we get into a runaway supply/demand imbalance.
I closed out some of the current inventory of trades today, some that we’ve held for quite a while.
Short-Term Outlook: Prices are breaking from a massive consolidation pattern in play since early 2018, or almost another “horizontal bear market” like we had in 2015-2016. All that energy that’s been coiled up has to go somewhere, the policy and odds favor it to go higher, and the first weekly trend is playing out in that direction..
Please sign up for our free daily crypto report here.
Offensive Actions
Offensive Actions for the next trading day:
- I’ll try to enter new DIS call spreads; see “Whale” section below.
Defensive Actions
Defensive actions for the next trading day:
- Any vertical, butterfly, or diagonal debit spreads that we set up are risk-managed from day one, and no defense is really required.
Strategy Summary Graphs
Each graph below represents a summary of the current performance of a strategy category. For an explanation of what the graphs mean, watch this video.
Non-Directional Strategies
Semi-Directional Strategies
Directional Strategies
%
%
%
Technical Analysis Section
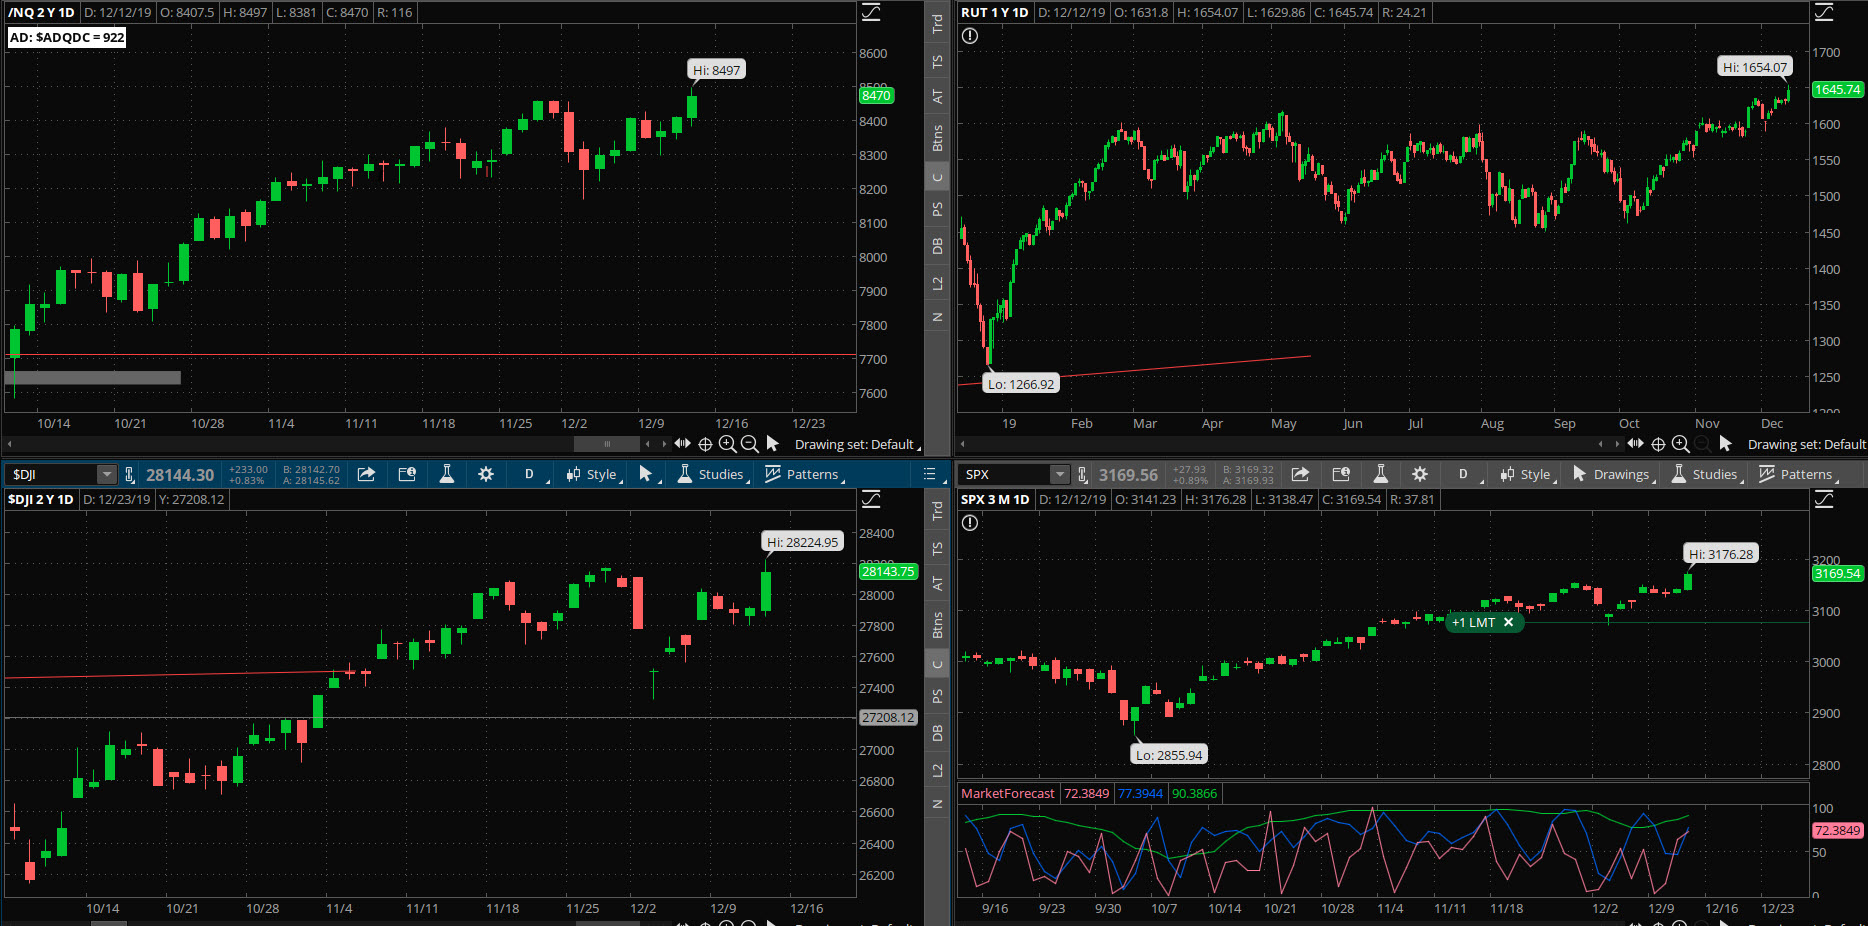
Market Internals: Volume was above-average today, with the advancers minus decliners coming in at a relatively strong +262.
SPX Market Timer : The Intermediate line has flattened in the Upper Reversal Zone and is still “Bullish.” No leading signals today but very close to yet another Full Bearish Cluster with all three timeframes in the Upper Reversal Zone.
DOW Theory: The SPX is in a long term uptrend, an intermediate uptrend, and a short-term uptrend. The RUT is in a long-term uptrend, an intermediate sideways trend, and a short-term uptrend. The Dow is in an intermediate uptrend and short-term uptrend.
VIX: The VIX fell to 13.94, inside the Bollinger bands. The RVX fell to 16.63 and is inside the Bollinger bands. There has been a pretty extreme bollinger squeeze happening on the VIX and RVX that we’ve pointed out for weeks.
Fibonacci Retracements: The price has bounced at the 23.6% fib of the October swing.
Support/Resistance: For the SPX, support is at 2825 with overhead resistance at 3154. The DOW has support at 25500 and overhead resistance at 28175. The RUT has support at 1450 and resistance around 1635.
Fractal Energies: The major timeframe (Monthly) is charged again with a reading of 43, but is starting to reflect the very linear trend from late 2018. The Weekly chart has an energy reading of 36, deeper into exhaustion. The Daily chart is showing 40, just above exhaustion again.
Other Technicals: SPX Stochastics flattened at 68, mid-scale. RUT Stochastics flattened at 74, below overbought. The SPX MACD rose below the signal line, showing an increase in positive momentum. The SPX is above the upper bollinger band with the range 3087 to 3164. The RUT is at the upper bollinger bands with the range 1576 and 1650.
Position Management – NonDirectional Trades
I have the following positions in play at this time:
- SPY 20DEC 296/297*319/320 Long Iron Condor (11/4) was entered for a $.17 debit on the puts and a $.16 debit on the calls. I closed the call spreads (12/12) for $.42 credit. Assuming that the put spreads expire worthless, this gives me a net return after commissions of $5.10/contract or a 15.4% return on capital. I decided to sell the position into strength at a less-than-target level as we only have days of time left in the position.
No additional positions at this time.
I have the following positions in play:
- SPX 23DEC 3015/3020*3150/3155 Iron Condor (12/3) was entered for a $2.50 credit. I have a $1.80 GTC debit exit order placed. The weekly SPX chart is in exhaustion so the odds do favor a sideways chop even though seasonality might override that.
I have no current positions:
Calendar spreads are good for markets in quiet/trending character. If the market reverts back to quiet/trending, then I’ll look to continue this method; if we see the daily chart go into exhaustion I’ll set up a back week calendar.
The calendar spread tracking sheet is available for your download here. Yes, if you follow the math in the sheet, all of the numbers account for commissions in and out of the trade. Please note: If you trade these positions please keep the size small, to the point where you “do not care” about the success or failure of this position.
I have the following positions in play:
- SLV Stock – I have 1000 shares of the SLV that was assigned at the $15 level. Looking for the next rally to sell calls against.
No other trades at this time. A lot of stocks in our price range ($50 and lower) look very poor right now. This is in line with the general divergence that we’ve seen lately.
Position Management – Directional Trades
Thoughts on current swing strategies:
- 8/21 EMA Crossover – The long cross has fired and is gone. The next entry would be off of the 21ema which occurred the week of Dec 2.
- RSI(2) CounterTrend – I’ll look for the next setup.
- Daily S&P Advancers – Looking for the next signal to go long with single-digit advancers to close the day.
- Swing – None at this time..
BTC and other top-ten coins are once again in a downtrend; could this be the final capitulation after slipping into a Bear almost two years ago?
Investors should currently be looking to find technical entries to warehouse BTC/ETH/LTC assets for eventual trades on Alt-coins. You should also be looking to devices like “trezor” or other cold-storage devices to keep your assets off of the network, or other secure wallet such as Navcoin. Relying on the security of your broker is no longer good enough; no one can log into your ETrade account and “steal” your stock assets, but the whole nature of Cryptocurrencies and their portability means that someone can grab your assets and transfer them elsewhere. I will continue to discuss the tradingview platform in daily videos as I think that it is currently the best way to chart the “big three.”
From Friday’s close at SPY 314.87 there is a +/-4.194 EM into this coming Friday; this is slightly larger than the 3.869 EM from last week. The EM targets for this Friday’s close are 319.06 to the upside, and 310.68 to the downside.
We will continue to look for downside tests of the weekly EM. We got one entry last week but it was a difficult entry and I whiffed. Today’s breakout put the price near the upper EM but I’m unlikely to fade it.
I have no positions in play:
The scan that I discussed in the 8/4/2018 video is available to download for thinkorswim here: http://tos.mx/OvdVnz I will also be adding a second Larry Connors scan to this section as well; here is the Connors Crash scan: http://tos.mx/BhHuKL
I have the following positions in play at this time:
- SLV 20DEC 15.5/16.5 debit call spread (11/18) entered for $.42 debit. I will seek a 50% return.
- BAC 27DEC 33/34 debit call spread (11/25) was entered for $.50 debit. This position was closed (12/12) for a $.75 credit. This gave me a net profit of $22.40/contract or a 44.8% net return after commissions.
- PYPL 3JAN 108/109 debit call spread (12/2) was entered for $.50 debit. I will seek 50%.
I would like to enter a DIS call spread tomorrow using 10JAN options, and setting up the debit spread for about a $.50 debit using $1-wide spreads, buying the ITM and selling the first strike OTM.
The “Hindenburg Strategy” is meant to capture “value” from successive corrections that lead up to the final “death spiral” with a Bear Market. The basic principle is to buy 3-month out long puts on the SPY, and to finance those puts by the sale of credit spreads.
I have the following open positions at this time:
- SPY 21FEB 279 long puts (11/15) entered for $2.21 debit. I will look to clear half of the position on any test of the 200 sma, and the other half upon a 10% haircut in price.