

Daily Market Newsletter
May 22, 2019Non-Directional Strategies
Semi-Directional Strategies
Directional Strategies
Bitcoin/Crypto
View Doc's New Book
June Expiration
Day(s)
:
Hour(s)
:
Minute(s)
:
Second(s)
Market Commentary
Hello all. It is Alex here covering for Doc who is on vacation for the next couple of weeks.
After having seen some significant opening gaps over the last couple of trading days, equities today took a bit of a breather today. While the S&P’s were down close to 20 points in the pre-market, they started a steady recovery leading up to the opening bell, closing only modestly lower from yesterday’s close. Most of the indices traded in a relatively narrow range with the exception of the Russel which showed weakness in pre-market and never fought it’s way back through the course of the day ending down close to 1%. The Dow Jones, Nasdaq, and S&P’s all ended modestly down on average 0.4% loosing steam in the last minutes of the session. Today’s sideways grind provided the right environment for the VIX to contract another 1%, down to 14.80 and helped fractal energies to recharge. Oil was down close to 3% today furthered by fears of overall worldwide economic contraction. As discussed in yesterday’s newsletter, all time frames are are continuing to charge up even further and on the S&P’s we continue to work sideways within a consolidation wedge. The daily time frame on the S&P’s has now charged up to over 0.55, up another couple of points over the last day. Volume has steadily declined over the last 3 sessions, further hinting that we may not see any significant moves until after the Memorial Day weekend. As discussed yesterday, if we continue to see narrow range movement tomorrow, I will be looking to put on some non directional positions for next week’s expiration.
If you have any questions, please feel free to reach out to me at alex_docs_trading@outlook.com
Please sign up for our free daily crypto report here.
Offensive Actions
Offensive Actions for the next trading day:
- I will set up the next series of short calls on SLV by selling the 19JUL $15 calls; see “stocks” section below. I will keep this as an open order.
- No new orders for Monday.
Defensive Actions
Defensive actions for the next trading day:
- Any vertical, butterfly, or diagonal debit spreads that we set up are risk-managed from day one, and no defense is really required.
- Closing orders have been entered for all new spreads.
Strategy Summary Graphs
Each graph below represents a summary of the current performance of a strategy category. For an explanation of what the graphs mean, watch this video.
Non-Directional Strategies
Semi-Directional Strategies
Directional Strategies
%
%
%
Technical Analysis Section
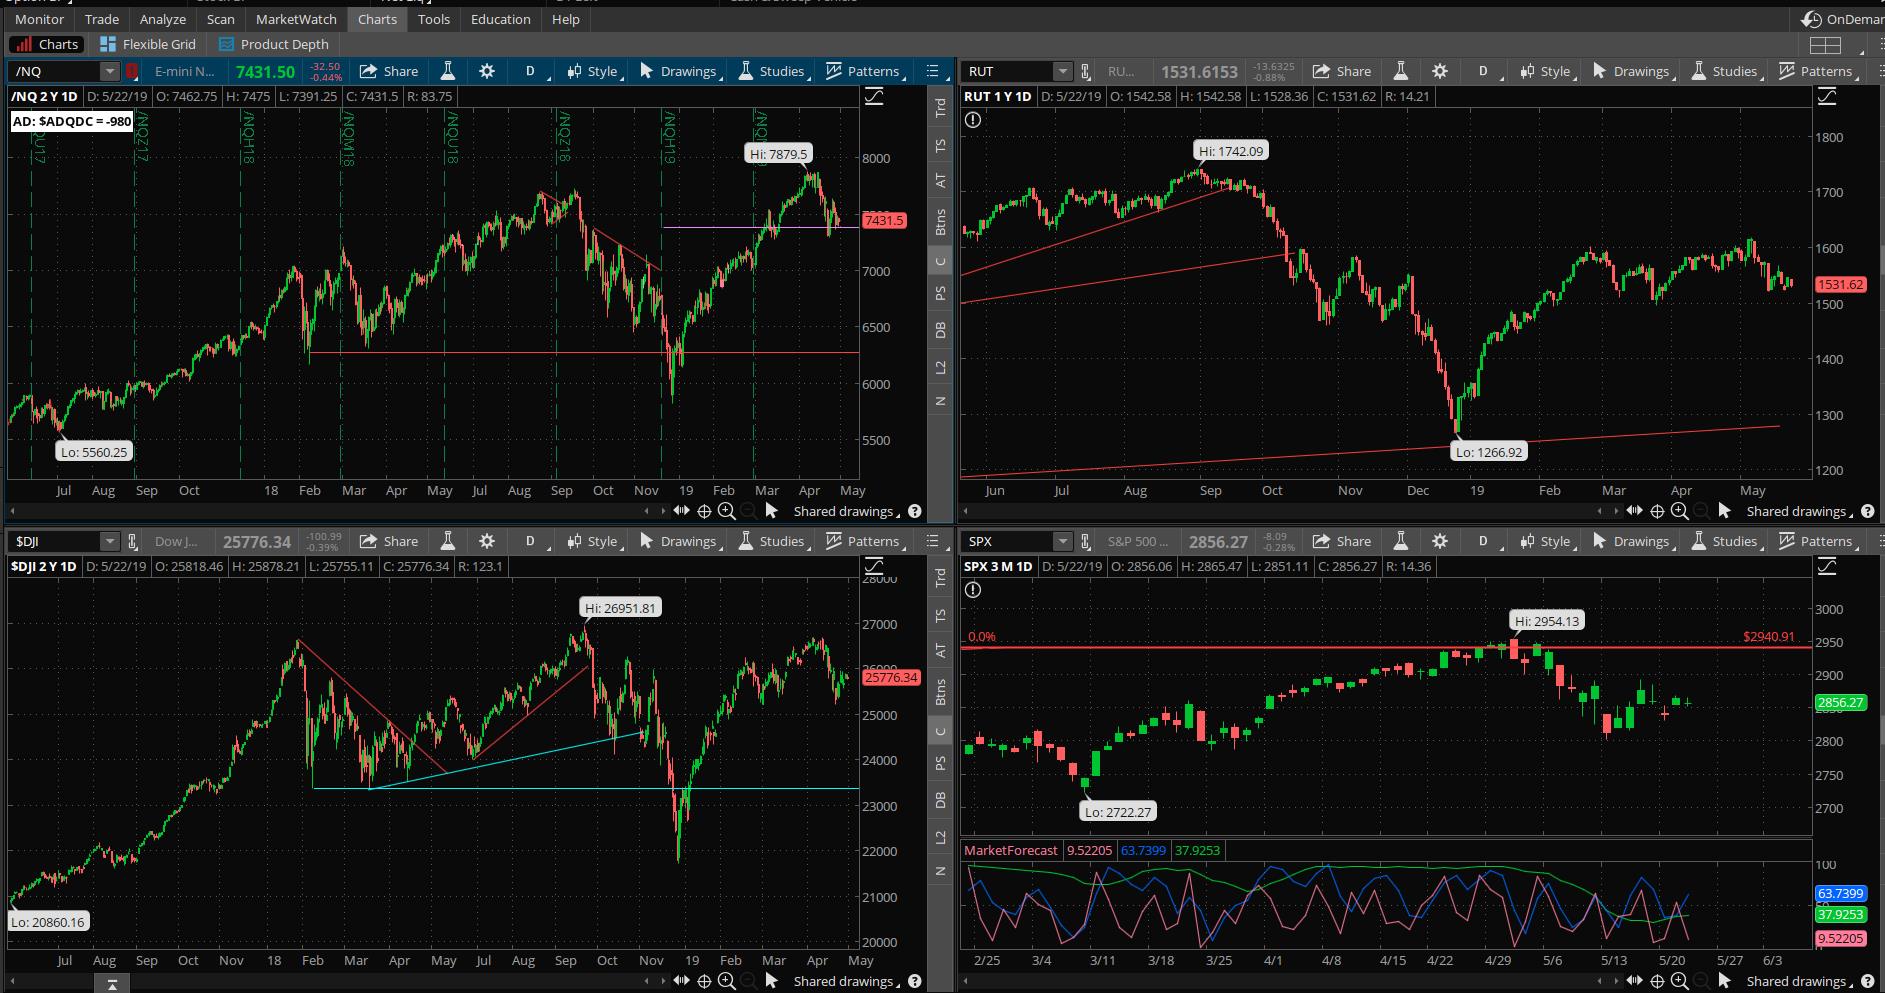
Market Internals: Volume was below average again on Wednesday, representing the third consecutive day of declining volume. The advancers versus decliners were mildly down at -104 after opening close to it’s low at -278 but steadily increasing right up to the end of the session when equities retreated in the last 20 minutes
SPX Market Timer : The Intermediate and momentum and near-term lines are in a divergent position. No leading signals at this time..
DOW Theory: The SPX is in a long term uptrend, an intermediate uptrend, and a short-term downtrend. The RUT is in a long-term uptrend, an intermediate uptrend, and a short-term downtrend. The Dow is in an intermediate uptrend and short-term downtrend.
VIX: The VIX fell to 14.75, inside the bollinger bands. The RVX increased almost 2% to 18.60 and is inside the bollinger bands showing divergence between the two indices as the Russel struggled for the majority of the trading day today
Fibonacci Retracements: The pullback had pulled price down to the 61.8% retracement of the March/April swing. We are now starting to see a consolidation wedge form between the 61.8% and 23.6% retracement values.
Support/Resistance: For the SPX, support is at 2791 … with overhead resistance at 2954. The RUT has support at RUT 1500 with overhead resistance at 1617 and 1742. All indices that we track recently showed a Death Cross with the 50ma crossing below the 200ma; this can be a leading signal for a true Bearish move. It can also signal “false” and create a massive swing higher. We might be seeing the latter scenario as the Dow ,S&P500, RUT, and /NQ have now printed a Golden Cross.
Fractal Energies: The major timeframe (Monthly) is charged again with a reading of 50 but slowly dropping as some of the old large moves work themselves off. The Weekly chart has an energy reading of 48, remaining flat with today’s movement. The Daily chart is showing a level of 55 which is charged again and continuing to charge up further with the sideways market movement. Should the SPX remain in a consolidation mode (it’s present wedge formation) then we would expect the daily energy to increase further getting us poised for a significant move.
Other Technicals: The SPX Stochastics indicator fell to 34, mid-scale. The RUT Stochastics indicator fell to 21, approaching the lower boundary. The SPX MACD histogram is below the signal line, showing continued downside momentum. The SPX is inside the Bollinger Bands with Bollinger Band support at 2807 and resistance at the upper band at 2970 with price is above the lower band. The RUT is inside the Bollinger Bands with its boundaries at 1513 to 1622 and price is above the lower band.
Position Management – NonDirectional Trades
I have no remaining positions in play:
- SPY 17MAY 282.5/283.5*297/298 Long Iron Condor (4/22) entered for $.16 on the put side and $.17 on the calls. The puts were closed (5/13) for a $.48 credit. This gave us a net $140 profit from the puts alone. The calls expired for a net $95 loss so our return on this trade was a net 27.2% after commissions.
With the S&P500 charts nearly at full energy again across the board, it might be time soon for another long condor.
I have no positions in play at this time.
No additional trades at this time; the timing is absolutely crucial on these trades so we have to find absolutely exhausted conditions prior to taking these entries.
I have no current positions:
Calendar spreads are good for markets in quiet/trending character. If the market reverts back to quiet/trending, then I’ll look to continue this method; if we see the daily chart go into exhaustion I’ll set up a back week calendar.
The calendar spread tracking sheet is available for your download here. Yes, if you follow the math in the sheet, all of the numbers account for commissions in and out of the trade. Please note: If you trade these positions please keep the size small, to the point where you “do not care” about the success or failure of this position.
I have the following positions in play:
- SLV Stock – I have 1000 shares of the SLV that was assigned at the $15 level. I will go out to the 19JUL series and sell the $15 calls for at least $.15 credit.
No additional stock plays until I return from travel 2nd week June; I’d like to see if the current pullback plays out a little deeper.
Position Management – Directional Trades
Thoughts on current swing strategies:
- 8/21 EMA Crossover – Looking for the next signal. I don’t like these signals to the short side.
- RSI(2) CounterTrend – None at this time.
- Daily S&P Advancers – Looking for the next signal to go long when we have single-digit advancers on the ADSPD.
- Swing – I set up a long swing trade on the Russell 2000 via the IWM (4/24), with a 24MAY IWM 163/164 debit call spread (4/24) for $.20 debit. At this point any kind of positive return on this trade would be welcome as I’m running out of time, a shame as this trade was within a penny of firing at my target.
Crypto had a big rally this week, and Bitcoin had a monstrous dump on Friday, effectively shaking off all of the late-to-the-party longs. So far the price action is positive.
Investors should currently be looking to find technical entries to warehouse BTC/ETH/LTC assets for eventual trades on Alt-coins. You should also be looking to devices like “trezor” or other cold-storage devices to keep your assets off of the network, or other secure wallet such as Navcoin. Relying on the security of your broker is no longer good enough; no one can log into your ETrade account and “steal” your stock assets, but the whole nature of Cryptocurrencies and their portability means that someone can grab your assets and transfer them elsewhere. I will continue to discuss the tradingview platform in daily videos as I think that it is currently the best way to chart the “big three.”
From Thursday’s close at SPY 285.84, there is a +/-5.309 EM into this coming Friday; this is about the same as last week’s 5.539 EM. The EM targets for this Friday’s close are 291.15 to the upside, and 280.53 to the downside.
The lower EM for this week lines up with the low test of last week, so this might be a good level to fade with an ITM call option should it be tested and offer support.
I will start playing directional bear spreads once we see upside exhaustion on more than one timeframe.
The scan that I discussed in the 8/4/2018 video is available to download for thinkorswim here: http://tos.mx/OvdVnz I will also be adding a second Larry Connors scan to this section as well; here is the Connors Crash scan: http://tos.mx/BhHuKL
I have no remaining positions in play at this time:
- TGT 17MAY 80/82.5 debit call spread (4/9) entered for $1.25 debit and expired OTM for a net $254 loss on two contracts.
- SBUX 31MAY 77/78 debit call spread (4/29) entered for $.48 debit and closed (5/16) for $.72 credit. This gave me a net profit of $20/contract or 42% net return on capital after commissions. .
- MCD 7JUN 197.5/200 debit call spread (5/6) entered for $1.14 debit and closed (5/17) for $1.57 credit, giving us a net $39/contract profit or a 34.2% return on capital after commissions.
We are also keeping an eye on the Momentum stocks in this section. Most of those are a little extended at this point and this pullback might do the rest of the market a lot of good. I would like to let the market settle first before going heavily long.
No other entries at this point.
The “Hindenburg Strategy” is meant to capture “value” from successive corrections that lead up to the final “death spiral” with a Bear Market. The basic principle is to buy 3-month out long puts on the SPY, and to finance those puts by the sale of credit spreads.
I have no positions at this time.